
FIGURE 2.
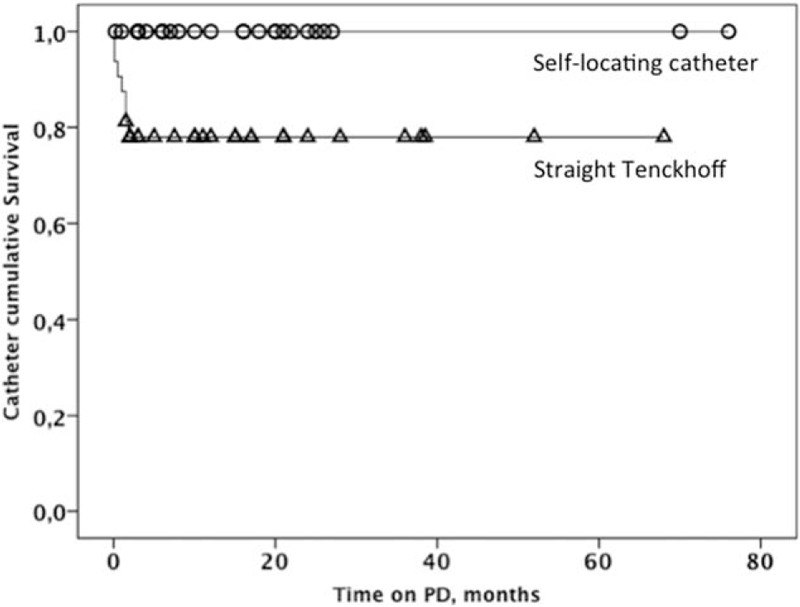
Kaplan–Meier distribution of catheter survival in relation to need of reoperation due to outflow failure. The self-locating Wolfram catheter is shown with open circles and the straight Tenckhoff catheter with open triangles.
Official websites use .gov
A
.gov website belongs to an official
government organization in the United States.
Secure .gov websites use HTTPS
A lock (
) or https:// means you've safely
connected to the .gov website. Share sensitive
information only on official, secure websites.
Kaplan–Meier distribution of catheter survival in relation to need of reoperation due to outflow failure. The self-locating Wolfram catheter is shown with open circles and the straight Tenckhoff catheter with open triangles.