Figure 3.
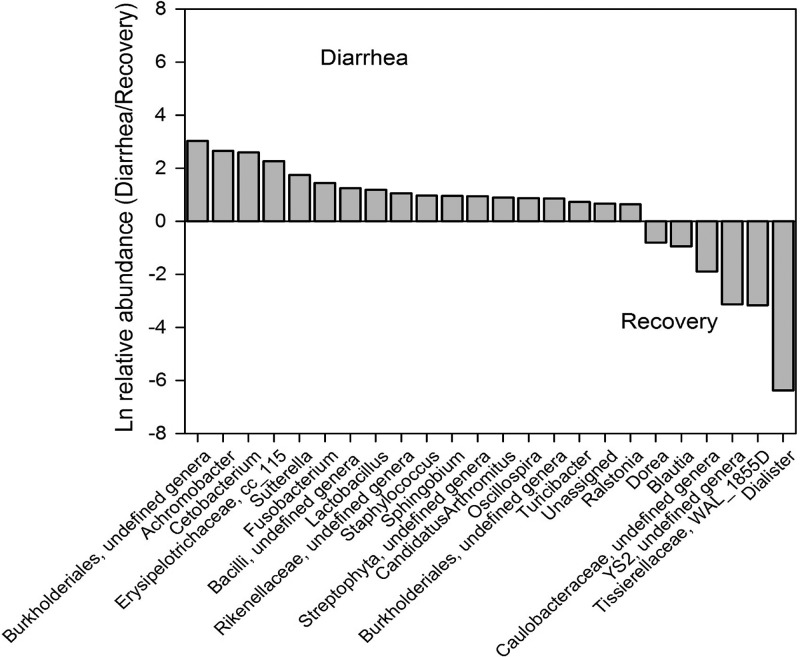
Ratio of the natural log of relative abundances of genera that differed* between the first diarrhea stool vs. recovery stool. *P < 0.05 unadjusted Wilcoxon signed-rank test. Using Wilcoxon signed-rank test adjusted by false discovery rate (FDR), only the difference in the relative abundance of Cetobacterium was statistically significant (P = 0.0217).

