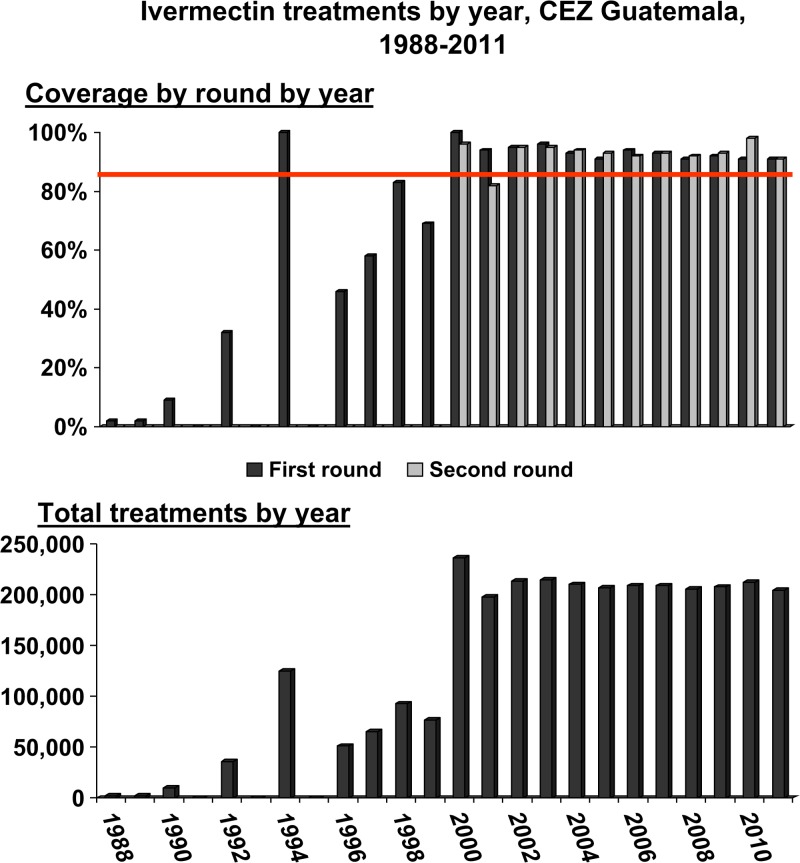
Figure 2.
The top panel shows the Central Endemic Zone (CEZ) treatment percent coverage of the eligible population during the years 1988–2011, by treatment round (dark bars first round, light bars second round). The horizontal line indicates the coverage goal of ≥ 85% per round. The bottom panel shows single bars representing the total treatments provided by year (the bars represent the sum of treatments given during the year in those years when two rounds were given). Mass drug administration (MDA) was halted in 2012 after over 2.9 million cumulative treatments had been delivered over the period.

