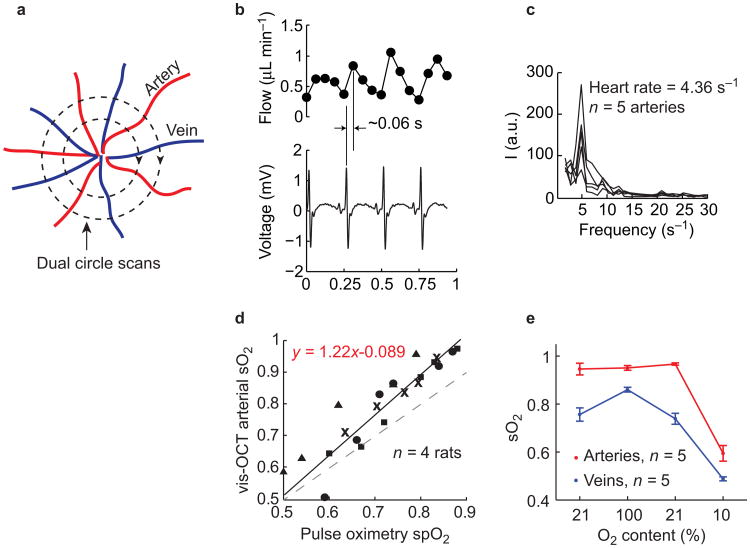
Figure 2.
Validation of blood flow and sO2 measurements in vivo using vis-OCT. (a) Illustration of scanning pattern for flow measurement. Two concentric circular trajectories around the optic disk scan cross all the major retinal blood vessels. (b) Pulsatile flow pattern from arterioles and the simultaneous recorded EKG signal. (c) Fourier transform of the pulsatile flow pattern from all arterioles showing the heart rate. (d) Correlation of arterial sO2 measurement by vis-OCT (y-axis) and spO2 measured by a pulse oximetry (x-axis). Measurements from different rats were labeled with different markers (n = 4 rats). Each vis-OCT sO2 was averaged from all the major arteries. Solid line plots the linear regression from all the data. Dashed line plots the ideal (unity slope) correlation line. (e) Variations in arterial (n = 5) and venous (n = 5) sO2 responding to the changing oxygen content of the inhaled air. Error bar = SEM.

