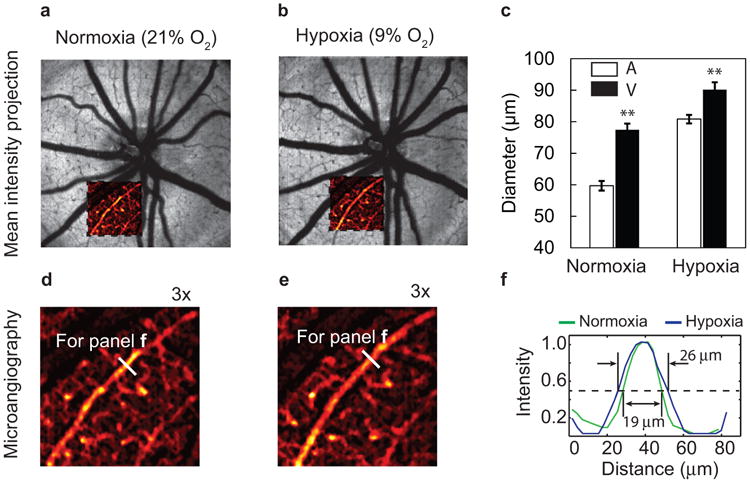
Figure 3.

Retinal vasculature diameter variation under hypoxia. (a–b) Mean intensity projection images around the optic disk under normoxia and hypoxia, respectively. The insets show pseudo-colored microvasculature images. (c) Comparison of average diameters of major arterioles (A) and veins (V) under normoxia and hypoxia (n = 33 from six rats). Error bar = SEM. (d) Magnified view of the inset in the panel a. (e) Magnified view of the inset in the panel b. (f) Comparison of the arteriole diameters highlighted in both panels d and e under normoxia and hypoxia. Bar: 200 μm. **p < 0.01 from two sample t-test.
