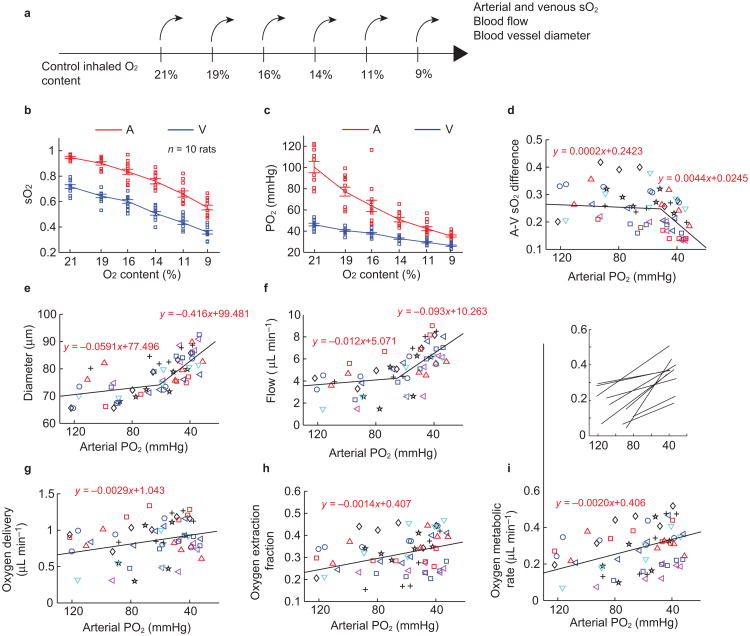
Figure 4.
Retinal oxygen consumption derived from retinal circulation in responding to systemic oxygen tension variation. (a) Progressive hypoxia challenge procedure. The oxygen content in the inhaling gas was reduced gradually in six steps from 21% to 9%. Arterial and venous sO2, blood flow, and blood vessel diameter were directly measured at each step. Arteriovenous sO2 difference, oxygen delivery, oxygen extraction fraction of retinal tissue, and rMRO2 were further calculated. (b) and (c) are sO2 and oxygen tension (PO2) changes under reduced oxygen content (red-arterial, blue-venous), respectively. The corresponding progression of (d) arteriovenous oxygenation difference, (e) average diameter of major retinal blood vessels, (f) retinal blood flow, (g) oxygen delivery from arterial vessels, (h) oxygen extraction fraction, and (i) retinal oxygen metabolism from retinal circulation. The solid lines in (d–i) are linear regressions from the scatter plots. Different rats were labeled with different markers (n = 10 rats). In i, regression lines for each rat are shown in the inset on the same axis as the main figure.

