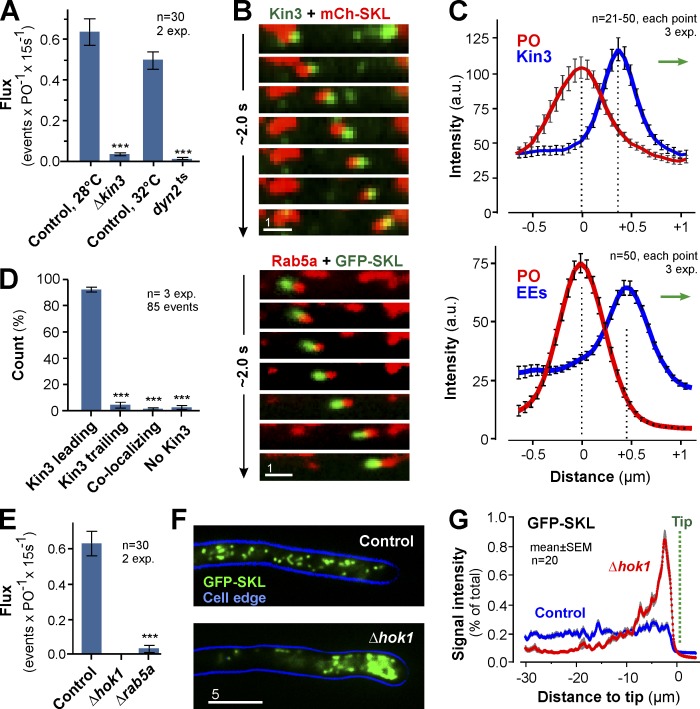
Figure 2.
EEs drive PO motility. (A) Flux of POs in controls, kinesin-3 null mutants (ΔKin3), and dynein mutants (Dyn2ts). Bars are mean ± SEM (n = 30 cells, 2 experiments). ***, P < 0.0001 versus control (Student’s t test). (B) Co-motility of a PO (top, red) and GFP-fusions to kinesin-3 (Kin3; top, green) and co-motility of a PO (green) and EE-associated mCherry-Rab5a (Rab5a; red). Image series covers 2.0 s. Images adjusted in brightness, contrast and gamma settings. Bar, 1 µm. See Video 3. (C) Intensity profiles of a co-migrating PO (red) and Kin3-GFP (Kin3; top, blue line) or EEs (bottom, blue line). Direction of transport indicated by green arrows. Data points are mean ± SEM of 21–50 cells from three experiments. (D) Position of Kin3 signals relative to co-moving POs. Bars are mean ± SEM (n = 3 experiments, 85 co-motility events). ***, P < 0.0001 versus control (Student’s t test). (E) Bidirectional flux of PO motility in control, Δhok1, and Δrab5a mutant. EE motility is almost abolished in both mutants (Bielska et al., 2014,). Bars are mean ± SEM (n = 30 cells, two experiments). ***, P < 0.0001 versus control (Student’s t test). (F) Distribution of POs, labeled with GFP-SKL, in control and Δhok1. POs form apical clusters in the absence of EE motility. Cell edge is indicated in blue. 2D-deconvolved maximum projection of a Z-axis stack, adjusted in brightness, contrast and gamma settings. Bar, 5 µm. (G) Fluorescent intensity profiles of GFP-SKL in control and Δhok1 cells. Position of cell tips is indicated (Tip). Each data point represents the mean ± SEM (20 cells, two experiments).

