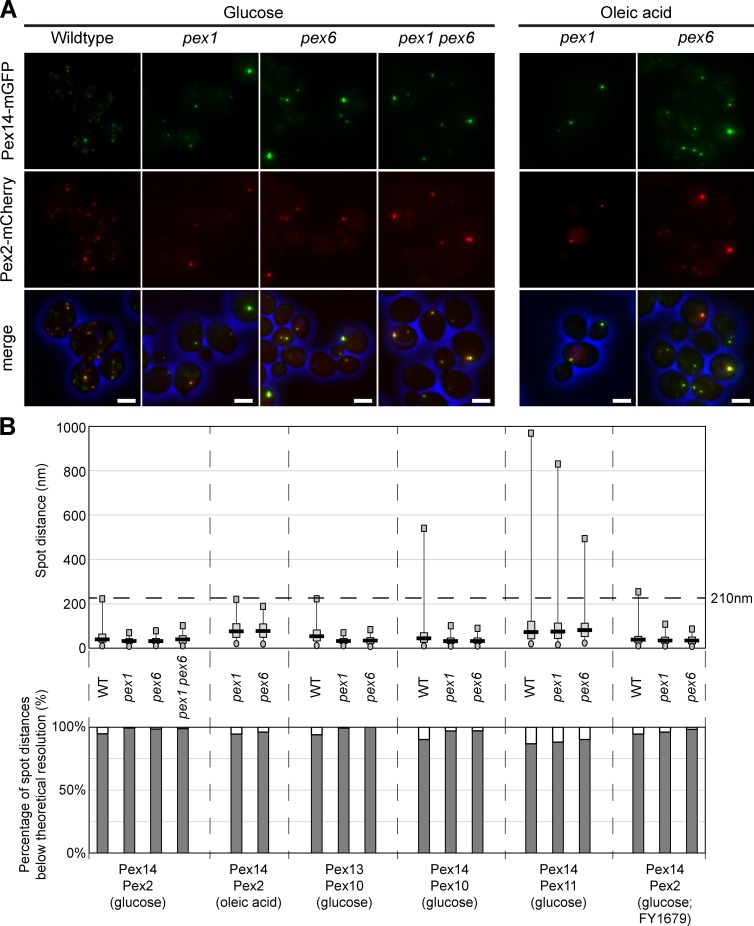
Figure 1.
Pex2 and Pex14 colocalize in pex1 and pex6 cells. (A) FM analysis of BY4742 WT, pex1, pex6, or pex1 pex6 cells producing Pex14-mGFP and Pex2-mCherry, grown on glucose (4 h) or oleic acid media (16 h). Cells were fixed with formaldehyde and embedded in agarose before image acquisition at the Deltavision microscope. Bars, 2.5 µm. (B, top) The object based colocalization was determined by calculating the distance between the centers of gravity of the mGFP and mCherry spots of the different indicated PMPs. The dashed horizontal line at 210 nm indicates the lateral resolution limit that theoretically can be achieved with our setup. The circles represent the best fifth percentile and the squares the worst fifth percentile. The gray box is limited by the 25th and 75th percentile, whereas the black line represents the median. For all measurements, n was at least 250 measurements. (bottom) Percentages of spots below the resolution limit.

