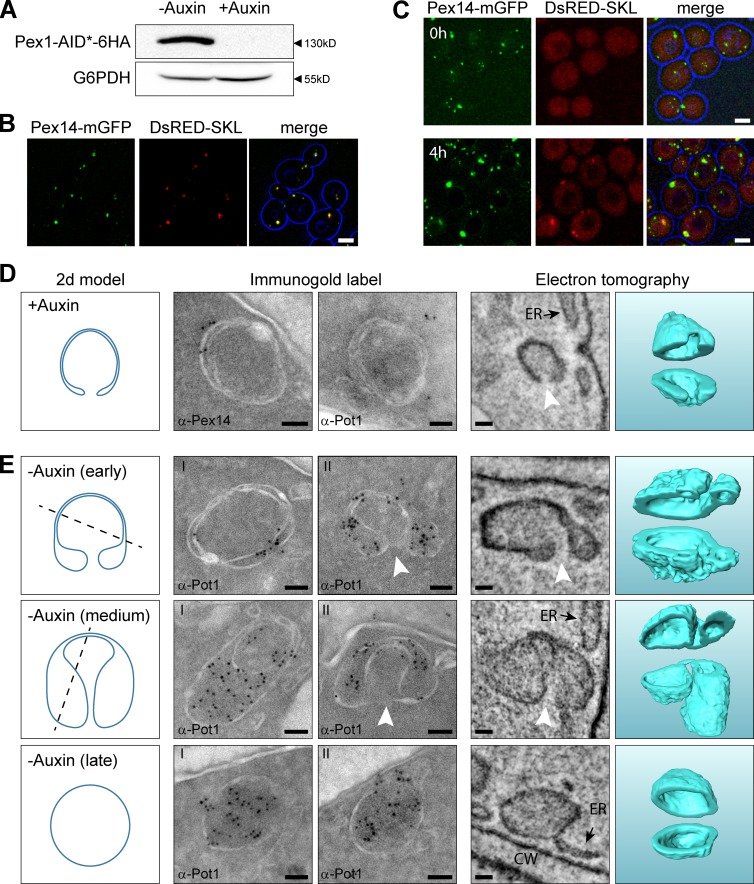
Figure 4.
Peroxisomal ghosts import matrix proteins upon reintroduction of Pex1 in Pex1-deficient cells and develop into peroxisomes. (A) Western blot analysis of total cell extracts of Pex1-AID* cells using α-HA antibodies, to demonstrate the presence of the Pex1-AID*-6HA fusion protein. Cells were precultivated for 16 h on glucose medium followed by 4 h on oleic acid medium in the presence or absence of 1 mM auxin. Equal amounts of protein were loaded per lane. Glucose 6-phosphate dehydrogenase (G6PDH) was used as loading control. (B and C) Confocal laser scanning microscopy (CLSM) analysis of Pex1-AID* cells grown for 16h on glucose medium followed by incubation for 4h on oleic acid medium in the absence (B) or presence (C, top; T = 0 h) of auxin. (C–E) Pex1-AID* cells, precultivated for 16 h on glucose and subsequently for 4 h on oleic acid medium in the presence of auxin, were shifted to oleic acid medium without auxin (T = 0 h). CLSM analysis revealed that after 4 h of incubation in the absence of auxin (C, bottom), DsRed-SKL spots became detectable that colocalized with Pex14-mGFP. (D) Immunogold labeling and ET showing that at T = 0 h rounded structures are present in the cells. In cross sections, the structures are visualized as double rings. The structures lack thiolase (α-Pot1) but contain Pex14. ET revealed that these structures are rounded and contained a single opening to the cytosol (white arrowheads). (E) After 2 h of growth on oleic acid in the absence of auxin, thiolase accumulated at the structures as evident from immunolabeling using α-Pot1 antibodies. The left panels in D and E show 2D models of common sections that were observed in both iEM and ET. The dashed lines illustrate cutting planes that explain the left iEM image, whereas the 2D model represents the right iEM image as well as the left ET panel, which shows a 10-nm-thick section through the ET volume. The ghost and the different stages of peroxisome formation are 3D modeled in the right ET panel and cut open for visualization purposes. Bars: (B and C) 2.5 µm; (D and E) 50 nm. CW, cell wall.

