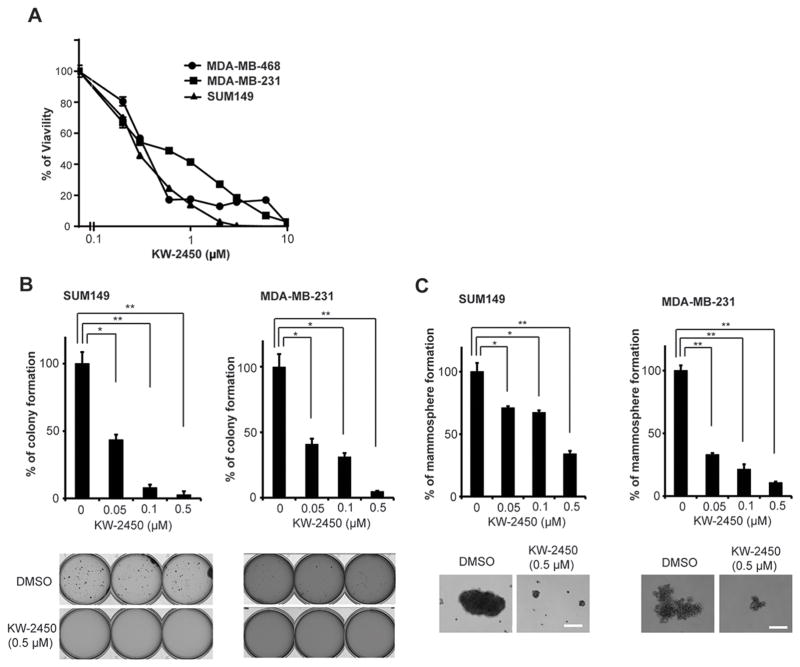
Figure 2. KW-2450 has in vitro antitumor activities against TNBC cells.
A, Growth inhibition assays of KW-2450 in vitro were performed by using the CellTiter-Blue assay. The viabilities of TNBC cells treated with KW-2450 were determined in reference to the control treatment, and the concentration-inhibition curve was drawn. Each point represents an average ± s.e.m. (bars) from quadruplicate. B, Colony formation in agar assay in TNBC cells treated with KW-2450 or DMSO. Histogram depicts percentage of colony formations of MDA-MB-231 or SUM149 cells treated with KW-2450 (0.05, 0.1, 0.5 μM) in relation to DMSO treatment, which was set at 100%. Representative images of colony formation in agar of SUM149 and MDA-MB-231 cells are shown at the bottom of histograms. C, Mammosphere-forming assay in TNBC cells treated with KW-2450 or DMSO. Histogram depicts percentage of mammosphere formation of SUM149 and MDA-MB-231 cells treated with KW-2450 (0.05, 0.1, 0.5 μM) in relation to DMSO treatment, which was set at 100%. Representative images of mammospheres of SUM149 and MDA-MB-231 cells are shown at the bottom of histograms (Scale bar, 100 μm). B, C, Error bars, standard error of mean (s.e.m.). *, P < 0.05; **, P < 0.01.

