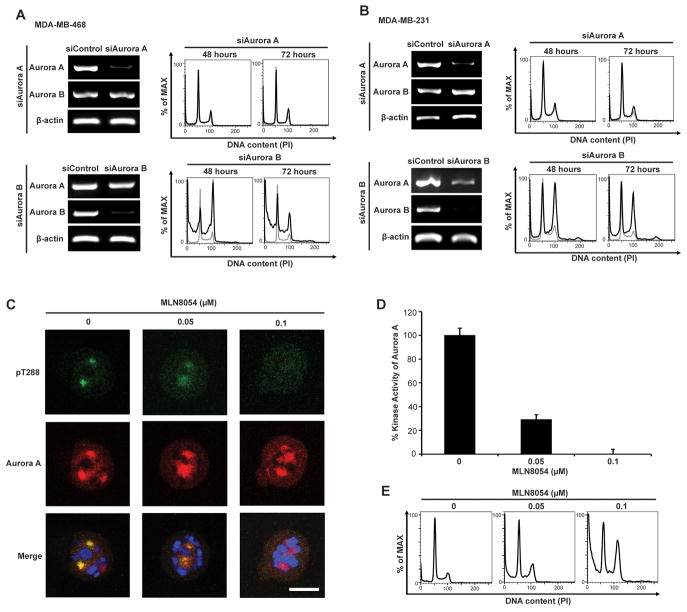
Figure 4. Pharmacological inhibition of Aurora A or siRNA knock down of Aurora B induced 4N and apoptosis as seen in KW-2450 treatment.
A, B, Knockdown experiments with siRNAs that target Aurora A or Aurora B in MDA-MB-468 cells (A) and MDA-MB-231 cells (B). Left of A or B, Knocked down efficiencies are shown by RT-PCR analyses using PCR primers that were designed to amplify the partial sequence of Aurora A or Aurora B gene. Right of A or B, Representative histograms depict DNA profiles of MDA-MB-468 and MDA-MB-231 cells treated with siRNAs to Aurora A or to Aurora B for 48 or 72 hours. The DNA profiles treated with control siRNA are overlapped with the corresponding sample histogram and shown as gray lines. C, D, E, Pharmacological inhibitions of Aurora A with Aurora A–specific inhibitor MLN8054 in MDA-MB-468 cells. C, Immunofluorescent images of MDA-MB-468 cells probed with antibodies to p-Aurora A (pT288) and pan-Aurora A. Nuclei were counterstained with DAPI. Scale bar, 10 μm. D, Histograms depicts percentage of Aurora A kinase activities in MDA-MB-468 cells treated with DMSO or MLN8054 (0.05, 0.1 μM). E, Cell cycle histograms of MDA-MB-468 cells treated with DMSO or MLN8054 (0.05, 0.1 μM).

