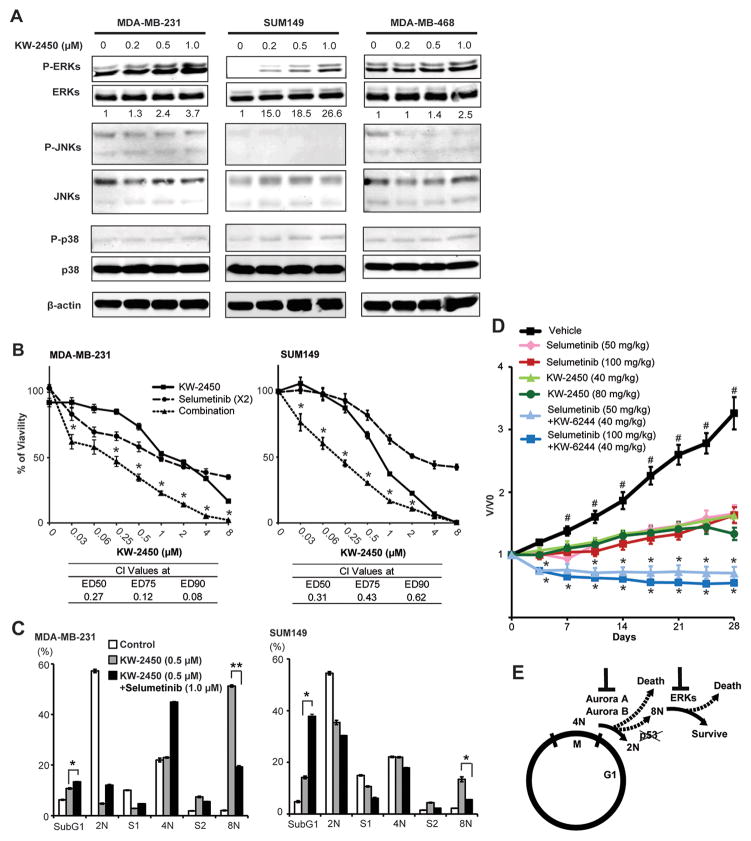
Figure 6. KW-2450 and selumetinib synergized in antitumor effect against TNBC in vitro and in vivo.
A, Western blots for phosphorylated forms of MAPKs (i.e., ERKs, JNKs, p38 MAPK) in TNBC cells treated with various concentrations of KW-2450. Paired nonphosphorylated forms are also presented to show basic expressions of those kinases. The samples were collected at 24 hours (for SUM149) or 48 hours (for MDA-MB-231 and MDA-MB-468) of KW-2450 treatments. β-actin is shown as a loading control at the bottom of each. B, Line charts depict growth inhibition curves of MDA-MB-231 and SUM149 cells, treated with sequent doses of KW-2450, selumetinib, or KW-2450 plus selumetinib. The x-axis shows the dose series of KW-2450. At each dose, selumetinib was used with a double dose of KW-2450, described as ×2 in parentheses next to selumetinib. For example, at the 1 μM dose point for KW2450, the dose is 2 μM for selumetinib monotherapy and for combination with KW-2450. We applied CalcuSyn software to determine whether there is synergistic, additional, or antagonistic effects between these two drugs at 50%, 75%, and 90% of effective doses: ED50, ED75, and ED90, respectively. CI values from CalcuSyn are shown at the bottom of each bar chart. CI values <0.1 indicate very strong synergism; 0.10–0.30, strong synergism; 0.30–0.70, synergism; 0.70–0.90 moderate to slight synergism; 0.90–1.10, nearly additive; >1.10, antagonism. Asterisks indicate the dose points where we saw significant differences by t test in both comparisons: combination vs KW-2450, combination vs selumetinib. Statistical significance was set at P < 0.05 (marked with *). C, Each colored bar depicts the relative proportions of cell cycle phases (subG1, 2N, S1, 4N, S2, or 8N) in each treatment: control, KW-2450, KW-2450 plus selumetinib. SUM149 and MDA-MB-231 cells were treated for 2 days and then fixed with 70% ethanol, stained with propidium iodide (PI), and analyzed by FACS. Values are expressed as percentages of total counted cells. Data represent means ± s.e.m. SubG1, dead cells; 2N, diploid or G0/G1; S1, DNA-synthesis after G1; 4N, tetraploid or G2/M; S2, DNA synthesis after mitosis-failure; 8N, octaploid. *, P < 0.05; **, P < 0.005. D, Line charts depict growth curves of SUM149 xenografts treated with vehicle, single treatments, or combinatory treatments for 4 weeks. V/V0, volume at any treatment time point/volume at day 0. Each dot shows mean ± s.e.m. Volumes of tumors treated with vehicle were compared with each single treatment at each time point, and when statistically significant difference (P < 0.05) was seen in every comparison, # was noted along with the dots of the vehicle line. Volumes of tumors treated with combination therapies were compared with the corresponding paired single treatments, and when a statistically significant difference (P < 0.05) was seen in both comparisons,* it was noted along with the dots of the combinatory treatment lines. E, Model of cell fates of TNBC cells treated with Aurora A/B inhibitor and relevant molecules to those cell fates; apoptosis or surviving 8N cells.

