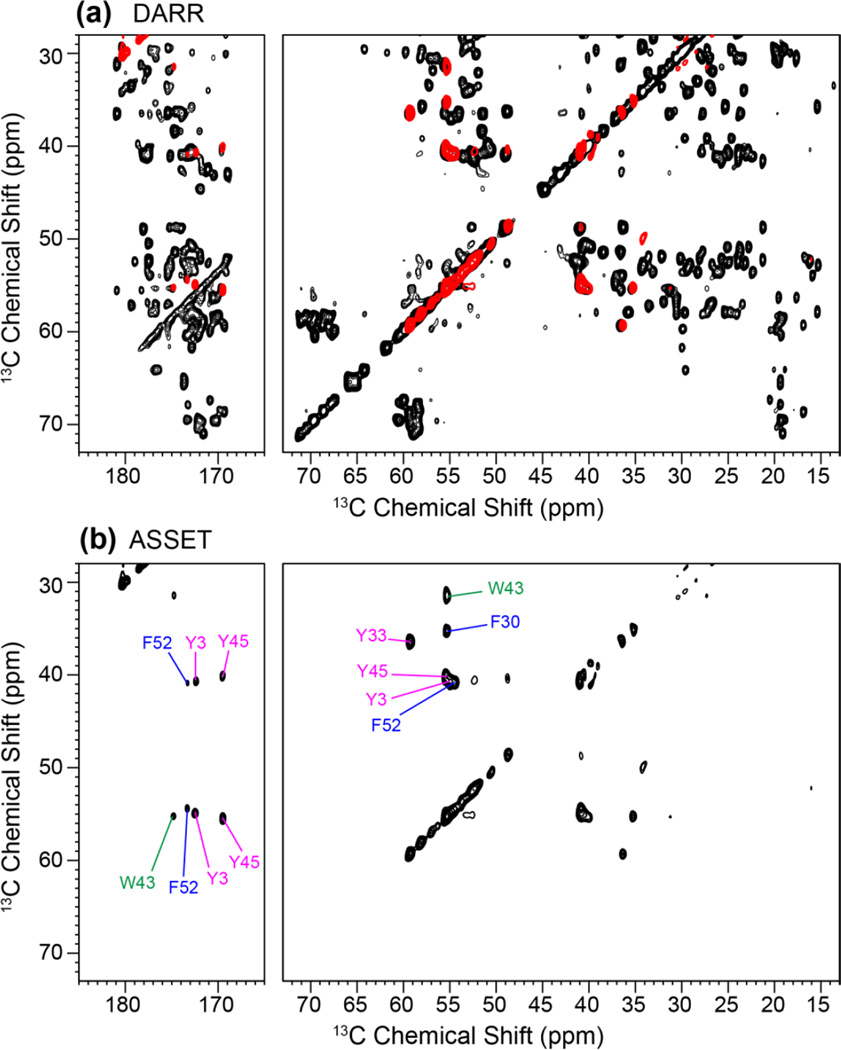
Figure 7.
2D 13C DARR (a) and ASSET (b) spectra of GB1. The ASSET spectrum was acquired with tarom = 25 ms and shows only the Cα - Cβ and Cα/β-CO cross peaks of the six aromatic residues while suppressing the signals of all aliphatic residues. The ASSET spectrum is reproduced in red in (a) and superimposed on the full PDSD spectrum.

