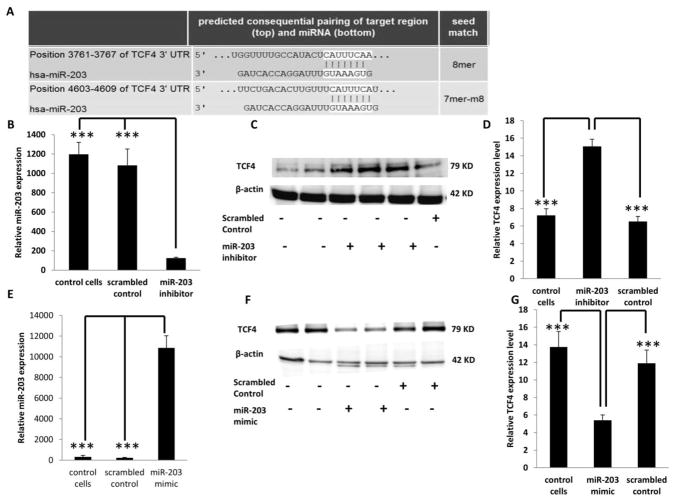
Figure 5. TCF4 expression following knockdown or overexpression of miR-203.
(A) Predicted binding of miR-203 to the 3′ UTR of TCF4. (B) Knockdown of miR-203 was carried out by transfecting miR-203 inhibitor or scrambled miRNA inhibitor (control) in HCT116 cells. 48 h following transfection, miR-203 expression was measured by qRT-PCR. (C) TCF4 protein levels were measured by western blotting after miR-203 knockdown and β-actin was used as a loading control as described in the Materials and Methods. (D) Quantification of TCF4 levels in control (no transfection), scrambled control or miR-203 knockdown samples from immunoblot images. (E) Overexpression of miR-203 was carried out by transfecting miR-203 mimic or scrambled miRNA mimic control. miR-203 expression was measured by qRT-PCR 24 h later. (F) TCF4 protein levels were measured by western blotting after miR-203 overexpression and β-actin was used as a loading control. (G) Quantification of TCF4 levels in control (no transfection), scrambled control or miR-203 overexpressed samples from immunoblot images. Data represent means ± S.E. from six - eight replicate values obtained from three separate experiments. Significant differences between groups are indicated as ***P < 0.001.

