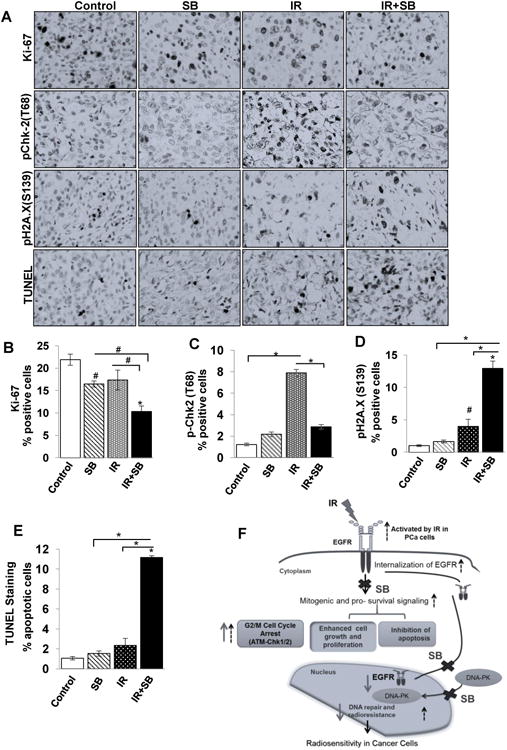
Figure 6. Combination of silibinin with IR leads to reduced expression of cell proliferation and DNA repair markers and enhances apoptosis in DU145 xenograft.

Tumor xenograft tissue samples were immunohistochemically analyzed for Ki67, pChk-2 (T68), pH2A.X and TUNEL-positive cells as detailed in Materials and Methods. (A) The representative pictograph (400× magnifications) for positive brown-stained cells (dark color) for each of the marker are shown from control, IR, SB and IR+SB groups. Quantitative data for (B) Ki67, (C) pChk-2(T68), (D) pH2A.X(S139) and (E) apoptotic cells from 5–6 mice in each group. P<0.01 (#), P<0.001(*) compared with respective control. (F) A model summarizing the radiosensitizing action of silibinin in PCa cells. Black dotted arrows represent pathways activated by IR in PCa cells, bold arrows represent the action of silibinin (SB) and crosses represent IR-activated responses blocked by silibinin.
