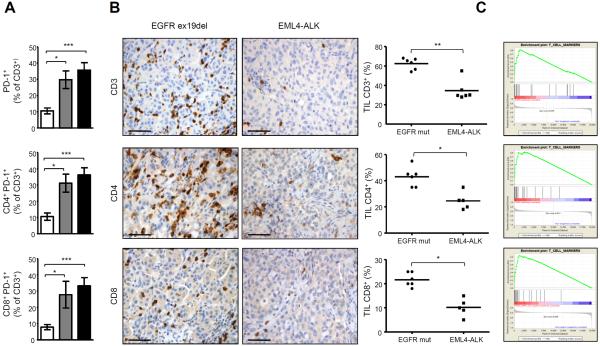
Figure 4. ALK induces an immunosuppressive microenvironment in ALK-rearranged NSCLC.
A, Lung immune infiltrates were stained with antibodies to CD3, CD4, CD8, PD-1 and analyzed by flow cytometry. Histograms show the mean percentage for each indicated population in WT mice (□, n= 5 mice), 12-week-old EML4-ALK mice ( , n= 5 mice) and 16-week-old EML4-ALK mice (■, n=9 mice). B, Immunohistochemistry for CD3, CD4 and CD8 on a representative mutated EGFR (ex19del) patient (left panels) and a representative EML4-ALK positive NSCLC case (right panels). Scale bars, 100μm. Graphs show the percentages of CD3+, CD4+ and CD8+ cells in EML4-ALK positive NSCLC vs EGFR mutated patients. Horizontal bars represent means. C, Gene Set Enrichment Analysis (GSEA) for T cell markers based on gene expression profiling of human EML4-ALK NSCLC vs EGFR mutated NSCLC (L858R or EGFR-Del19) (FDR q-Value: 0.008, top panel) or vs K-RAS mutated NSCLC (FDR q-Value: 0.001, central panel) or vs KRAS/EGFR/ALK negative NSCLC (FDR q-Value: 0.00046, bottom panel). *, P<0.05; **, P<0.005; ***, P<0.0005.

