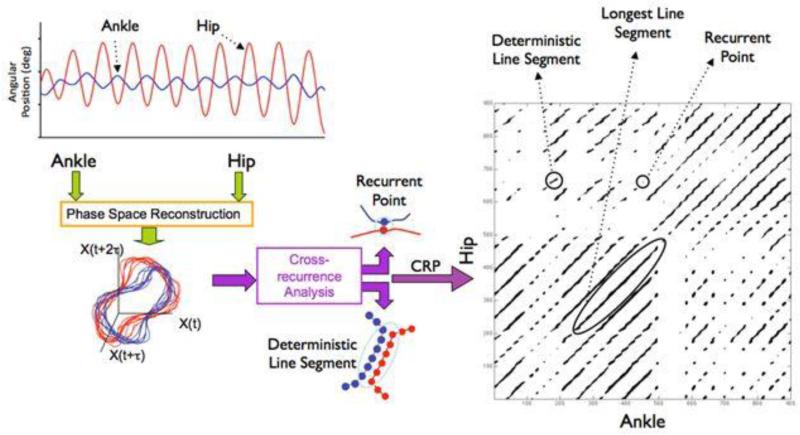
Figure 3.
Schematic of the computational process of CRQ. First the ankle and hip time series are embedded in higher-dimensional space. Next, the trajectories are compared to determine where they recur, or repeat, within some tolerance. Each instance of intersection between the two trajectories is a single recurrence and depicted on the cross-recurrence plot (CRP) as a darkened pixel and make up the %CREC measure. Strings of these darkened pixels are consecutive time points over which the two signals co-evolve and make up the %CDET measure. The longest line segment, CML, is the longest number of consecutive time points over which the two signals evolved.

