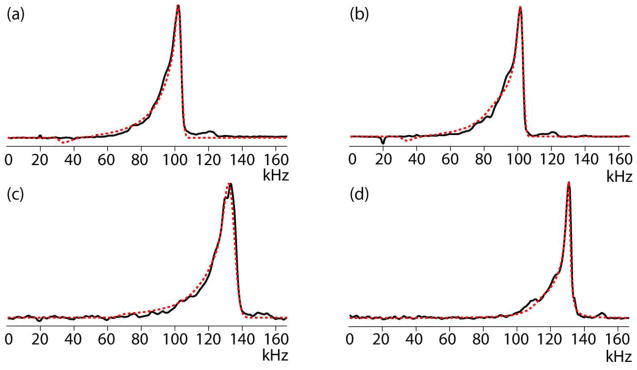
Figure 6.
Measured (black solid line) and simulated (red dashed line) CP-detection nutation spectra at 20 kHz MAS obtained in the 3.2 mm probe (top) and in the 1.6 mm probe (bottom), by applying CP without a ramp (left) or with a ±10% ramp on the X channel (right). The detected molecular sites are 13Cα in alanine (a, b), 13Cα of Met in MLF (c), and 15N in NAV (d). In the simulations, and of the CP irradiation were 70 and 46 kHz (a), 70 and 45.5 kHz (b), 90 and 64 kHz (c), and 73 and 50 kHz (d), respectively. The CP contact time was 1 ms (a, b, c) or 1.5 ms (d).

