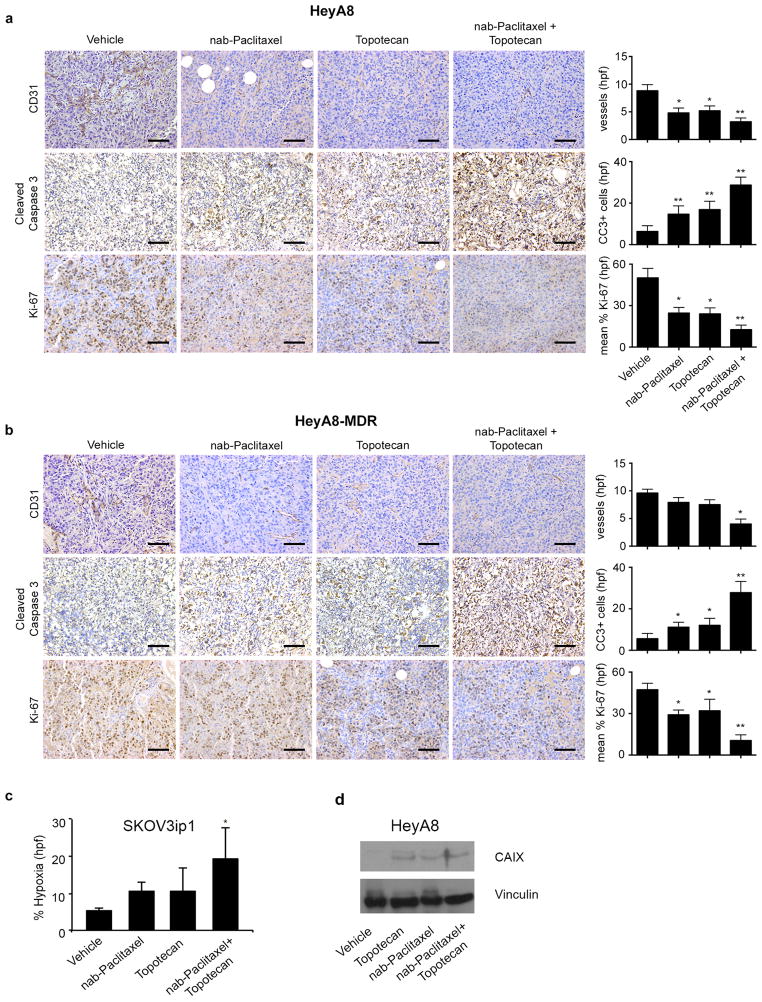
Figure 2. Biological effects of metronomic nab-Paclitaxel and metronomic topotecan.
a) Representative images of HeyA8 tumor samples immunohistochemically stained for CD31, cleaved caspase 3, and Ki-67 from mice treated with vehicle, metronomic nab-paclitaxel (2.5 mg/kg intraperitoneally every other day), metronomic topotecan (0.5 mg/kg orally every day), or a combination of metronomic nab-paclitaxel and metronomic topotecan. Error bars represent standard error of the mean (SEM). *p < 0.05 compared with vehicle. **p < 0.01 compared with vehicle. hpf: high-power field. b) Representative images of HeyA8-MDR samples immunohistochemically stained for CD31, cleaved caspase 3, and Ki-67 from mice treated with vehicle, metronomic nab-paclitaxel (2.5 mg/kg intraperitoneally every other day), metronomic topotecan (0.5 mg/kg orally every day), or a combination of metronomic nab-paclitaxel and metronomic topotecan. (original magnification ×100, scale bar represents 100 μM). Error bars represent SEM. *p < 0.05 compared with vehicle. **p < 0.01 compared with vehicle. hpf: high-power field. c) Percentage of tissue showing hypoxia in SKOV3ip1 tumor cells from each treatment group. Error bars represent standard error. *p < 0.05 compared with vehicle. d) Western blot images depicting the effect of vehicle, metronomic topotecan, maximally tolerated dose (MTD) nab-paclitaxel and combination on carbonic anhydrase IX (CAIX) expression from tumors in the HeyA8 orthotopic ovarian model.

