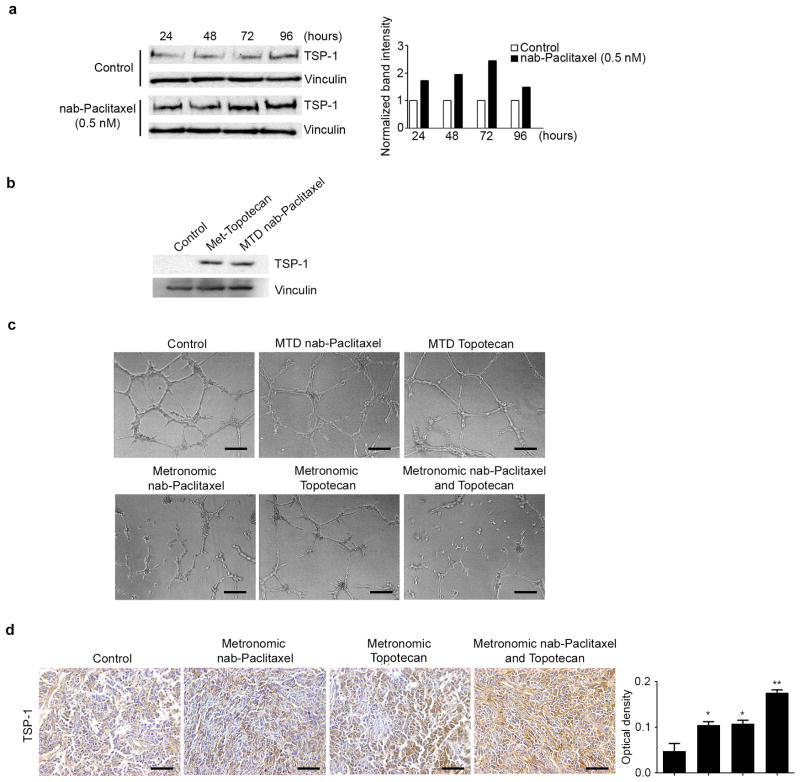
Figure 3. Effect of metronomic nab-Paclitaxel and topotecan on TSP-1 expression.
a) Western blot images depicting the effect of control (normal saline) and metronomic nab-paclitaxel on TSP-1 protein expression. HeyA8 cells were continuously treated with either vehicle or 0.5 nM nab-paclitaxel for up to 96 hours and cell lysates were collected at 24-hour time points. The graph shows the band intensity of TSP-1 normalized to the loading control, vinculin. b) Western blot depicting the effect of control (normal saline), metronomic topotecan (25 nM daily) and the maximally tolerated dose (MTD) of nab-paclitaxel (20 nM once) on TSP-1 expression. Cell lysates were collected after 72 hours. c) Tube formation of RF-24 cells after treatment with conditioned media of each treatment group, representative images shown. (original magnification ×100, scale bar represents 100 μM). d) Representative images of HeyA8 tumor samples immunohistochemically stained and quantified for TSP-1 (original magnification ×100, scale bar represents 100 μM). Error bars represent SEM. *p < 0.05 compared with vehicle. **p < 0.01 compared with vehicle.

