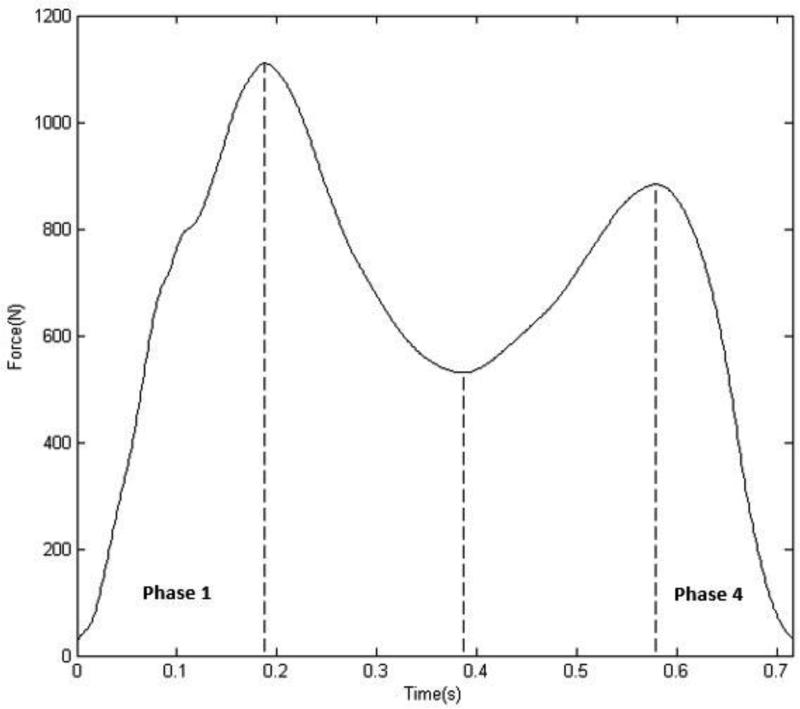
Fig. 1.
A representative example of a participant's vertical ground reaction force (GRF) profile during gait. The vertical lines (left to right) indicate the location of the first vertical GRF peak (P1), the minimum vertical GRF (M1) and the second vertical GRF peak (P2), which were used to divide the entire stance phase into four discrete regions. Phases 1 – 4 were defined as the time points between initial contact to P1, P1 to M1, M1 to P2 and P2 to toe-off, respectively.

