
Fig. 2.
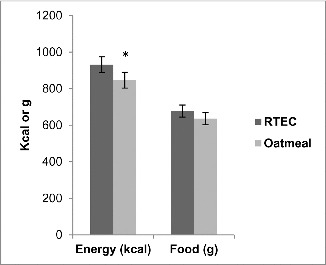
Energy and food intake at lunch meal following consumption of RTEC and oatmeal at breakfast (n = 48). Values are mean ± standard error. Asterisk indicates a significant difference (p = 0.012).
Official websites use .gov
A
.gov website belongs to an official
government organization in the United States.
Secure .gov websites use HTTPS
A lock (
) or https:// means you've safely
connected to the .gov website. Share sensitive
information only on official, secure websites.
Energy and food intake at lunch meal following consumption of RTEC and oatmeal at breakfast (n = 48). Values are mean ± standard error. Asterisk indicates a significant difference (p = 0.012).