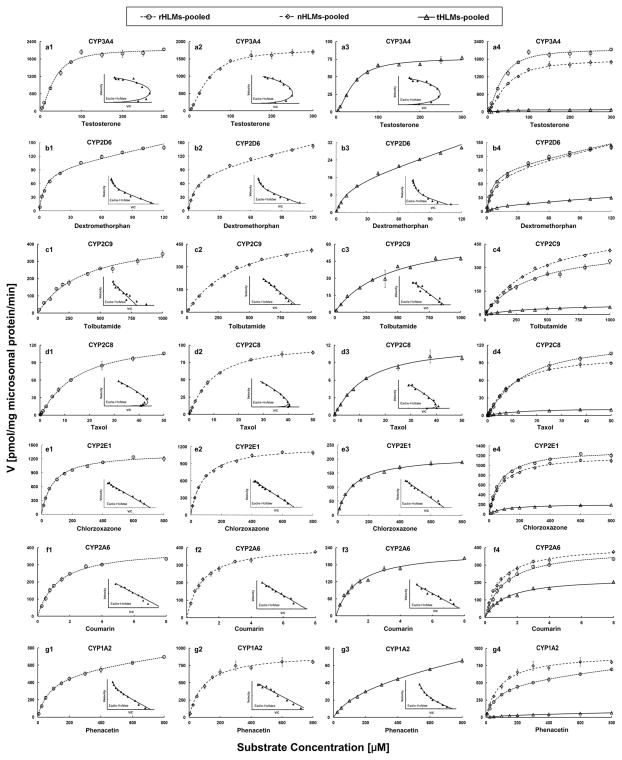
Figure 1.
Enzyme kinetic analysis for measuring activities of seven CYPs in rHLMs-pooled (Fig. a1–g1, circles and dotted line), nHLMs-pooled (Fig. a2–g2, diamonds and dashed line) and tHLMs-pooled (Fig. a3–g3, triangles and solid line) by using specific probe substrates. In each figure, the inset shows Eadie-Hofstee plot. (Fig. a4–g4) comparison of activity of each CYP isoform in rHLMs-, tHLMs- and nHLMs-pooled. Each data point represents an average of three determinations and the error bar represents standard deviation of the mean (n=3).

