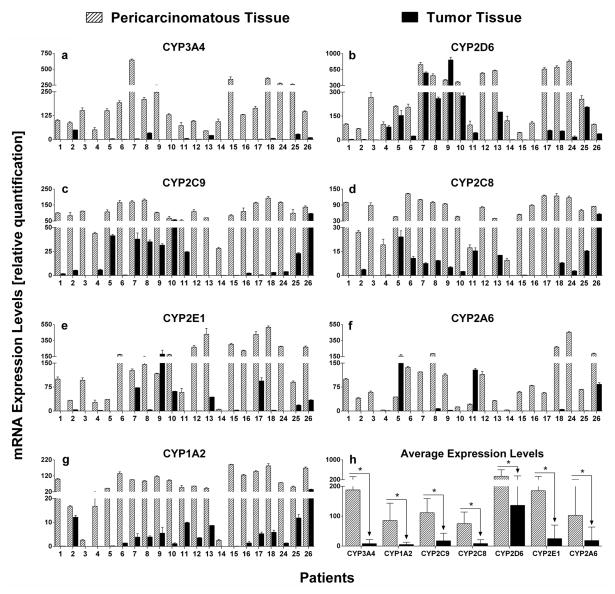
Figure 3.
mRNA expressions of seven CYP enzymes in tumors and matched pericarcinomatous tissues of 21 human livers with HCC(Fig. 3a–3g). Relative expression differences were calculated using the comparative ΔΔCt method, and Ct values were normalized to GAPDH expression levels. All measurements were performed in triplicate and the relative expression levels of the target genes were presented as 2−ΔΔCt×102. Data are presented as mean±SD, and paired-samples T-test was used for data analysis. (h) Average mRNA expression levels of each CYP isoform in 21 tumors and pericarcinomatous tissues. Wilcoxon’s sign rank test was used for data analysis. “*” denotes statistical significance (p<0.05).

