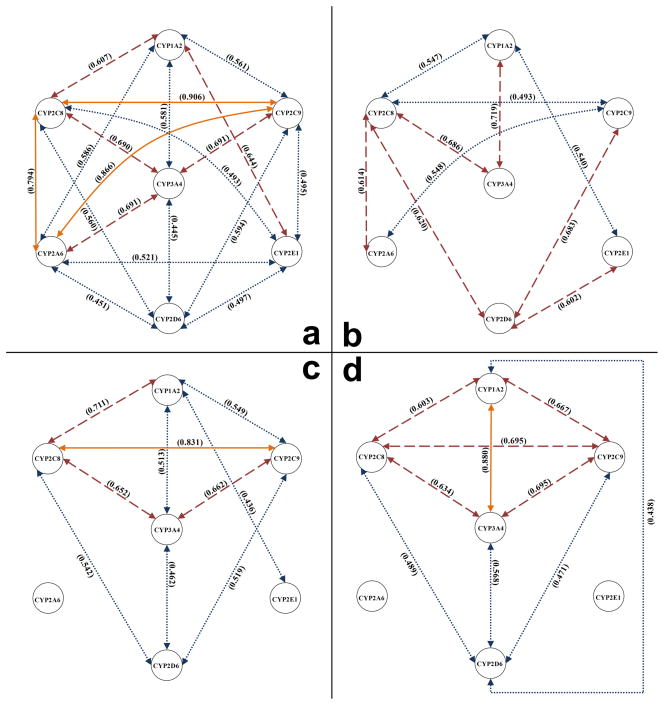
Figure 4.
Correlation Analysis of Various mRNA and Protein Levels. (a) Correlations between mRNA expression levels of seven CYP isoforms in pericarcinomatous tissues of patients with HCC (n=21). (b) Correlations between mRNA expression levels of seven CYPs in HCC tumors (n=21). (c) Correlations between protein expression levels of seven CYPs in pericarcinomatous tissues (n=25). (d) Correlations between activities of seven CYPs in pericarcinomatous tissues (n=23). Correlation analyses were performed using Pearson product-moment correlation for normally distributed data, and Spearman’s rank correlation for non-normally distributed data. Two of the seven isoforms were linked with each other using yellow solid lines (r2 ≥ 0.8), red dashed lines (0.8> r2 ≥ 0.6), or blue dotted lines (r2 < 0.6), when significant correlation (p<0.05) was observed.

