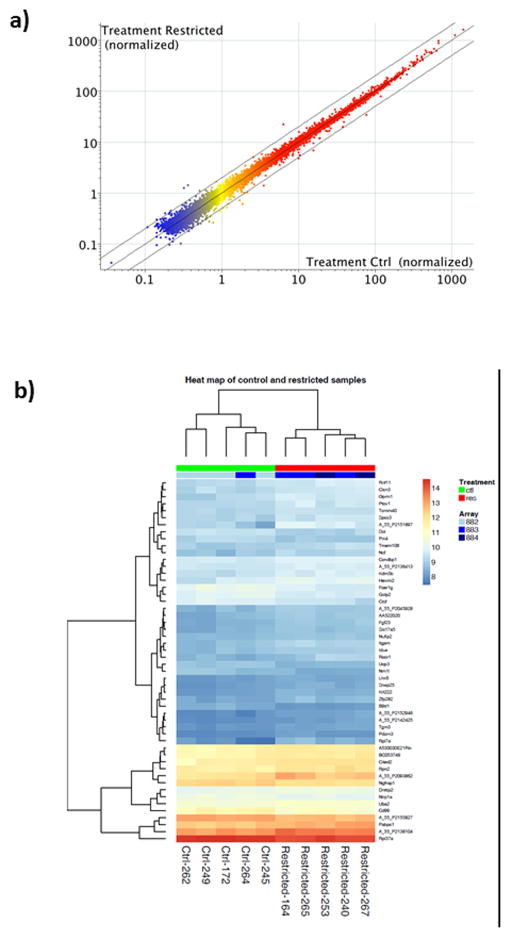
Figure 4.
Whole genome microarray analysis of five pairs of placentas from control and food restricted dams. (a) Scatter plot: genes present (above background) in all replicates of at least one treatment (15,430 probes) are displayed as normalized to the 75th percentile of each array. Red=High expression, Yellow=Medium expression, Blue=Low expression. Center line= identical expression, and outer lines = 2-fold difference. (b) Heat map based on 50 genes most likely to be differentially expressed. No significant differences in expression were found.

