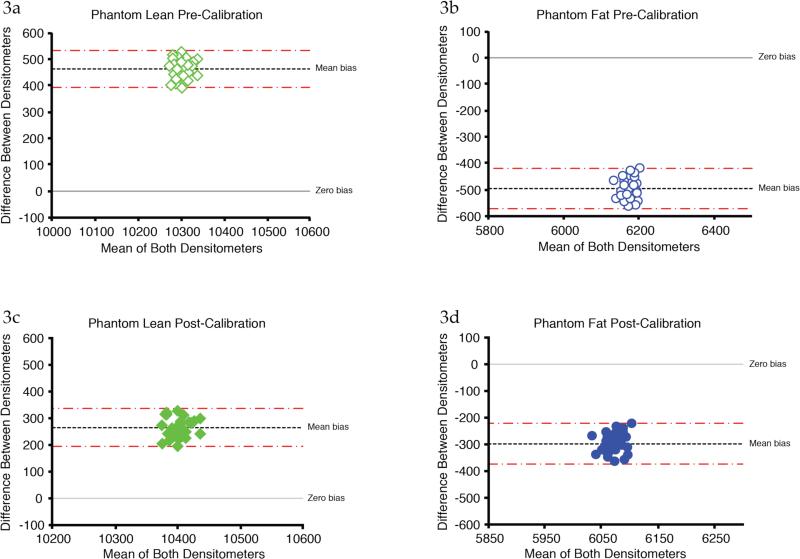
Figures 3. a-d: Bland-Altman Plots of Lean and Fat BioClinica Body Composition Phantom Data Before and After Recalibration.
Lean and fat differed between instruments by 4.6% & 7.8% with biases of +463 g & −496 g (3a-b). After recalibration, instrument agreement improved to 2.6% for lean and 4.8% in fat, with biases of +265 g and −298 g respectively (3c-d).

