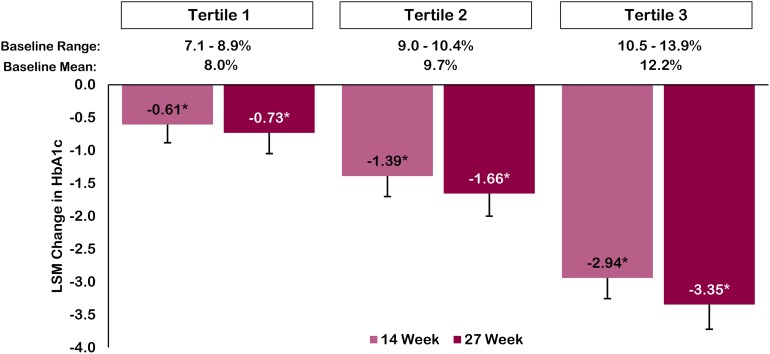
Fig. 3.
V-Go glycemic response by baseline HbA1c tertile. Tertile 1 (n = 80), tertile 2 (n = 62), and tertile 3 (n = 62). Data are LSM change in HbA1c with corresponding 95% confidence interval derived from a repeated measures mixed model for first recorded HbA1c on V-Go (14-week mean) and second recorded HbA1c on V-Go (27-week mean) from baseline by tertile. Time points represent the mean time elapsed between V-Go initiation and follow-up HbA1c results for the total population. *P < 0.001 compared to baseline. HbA1c glycated hemoglobin, LSM least-squares mean

