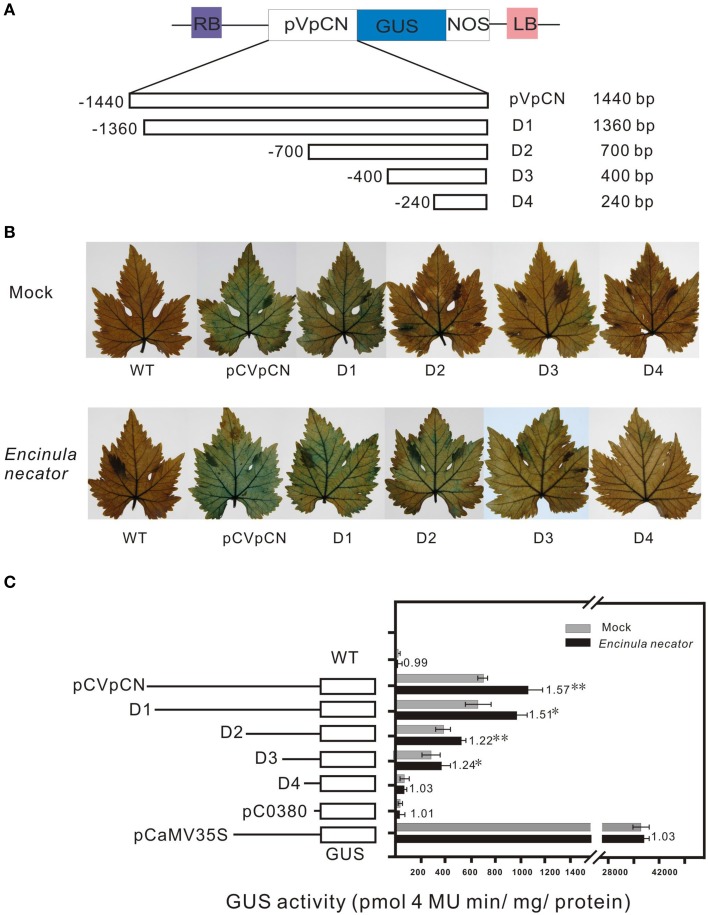
Figure 5.
Schematic map of the pVpCN promoter-GUS gene fusion deletion constructs, histochemical analysis of GUS expression in transiently transformed V. vinifera “Red globe” leaves after inoculation with E.necator, and fluorometric analysis of GUS activity in the transiently transformed grapevine leaves. (A) The GUS gene was driven by the VpCN promoter deletions, the exact locations of the promoter fragments are shown in Supplement Figure 2. The deletion size is indicated at the far right. (B) GUS staining was carried out 2 days after treatment with sterile water (upper panel) or E. necator (lower panel). (C) The various deletion fragments of the VpCN promoter fused to GUS and relative GUS activity driven in the transiently transformed grapevine leaves. The dark bars indicate the average GUS activity for deletion constructs in transiently transformed grapevine leaves treated with E. necator, the gray bars indicate the mock treatment (sterile water). Numbers adjacent to the bars indicate the fold difference in GUS activity leaves harboring the various constructs challenged with E. necator relative to the mock samples. The mean GUS activity (±SD) is averaged from three independent experiments (n = 3), the errors bars indicate the stand deviation. Significant difference between treatment and mock conditions was analyzed using one sided paired t-test (** and * meaning P < 0.0.1 or P < 0.05, respectively).

