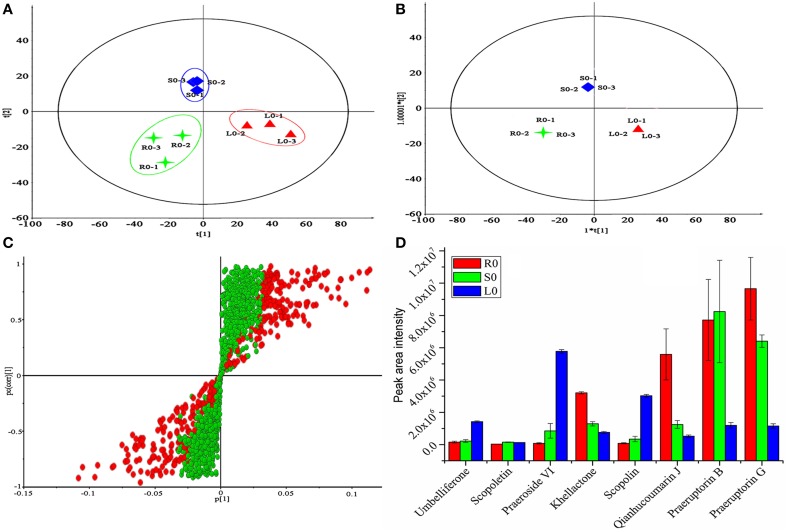
Figure 7.
Metabolomics analysis of P. praeruptorum extracts. (A) PCA scores plots. (B) OPLS-DA score plots. (C) OPLS-DA loadings plot derived from HPLC-Q-TOF-MS data of roots (R0), stems (S0), and leaves (L0). (D) Peak intensity of eight compounds between the three tissue groups. Each bar represents the mean value results from triplicate experiments ± standard deviation (SD); 1, 2, 3 represent the three parallel tests and 0 represent the tissue used in this study was no treated with MeJA.

