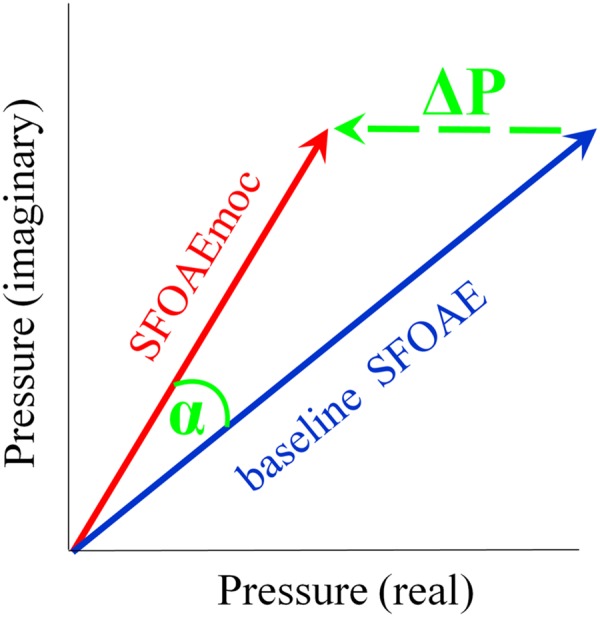
FIGURE 1.

Schematic of medial olivocochlear (MOC) modulation of stimulus frequency otoacoustic emissions (SFOAE). SFOAE without and with contralateral noise are denoted as baseline SFOAE (blue) and SFOAEmoc (red), respectively. MOC effects were assessed via both the vector pressure change ΔP (green) and phase change α.
