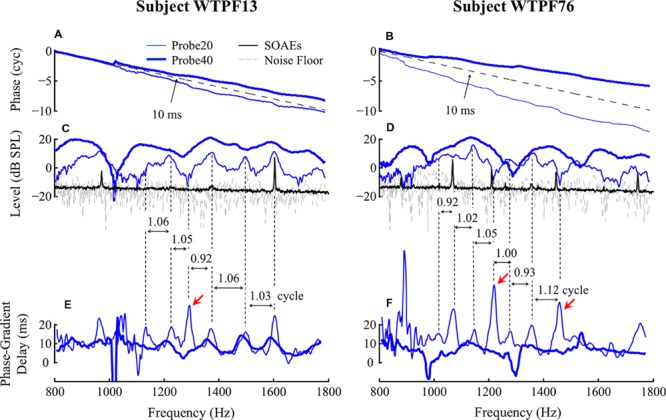
FIGURE 2.

Baseline SFOAE as a function of probe frequency for subjects WTPF13 and WTPF76 (columns). Data obtained using 20 and 40 dB SPL probes are represented using thin and thick traces, respectively. SFOAE phase slopes are parallel with the phase slope of 10-ms delay (dashed reference line in A,B). Fine structure patterns of SFOAE level (C,D) and phase-gradient delay (E,F) are presented along with SOAE in panels (C) and (D) using the black traces. Vertical dashed lines are used to mark the alignment between fine structure patterns of level and delay. Red arrows indicate (the less common) alignment between SFOAE level valleys and phase-gradient delay peaks.
