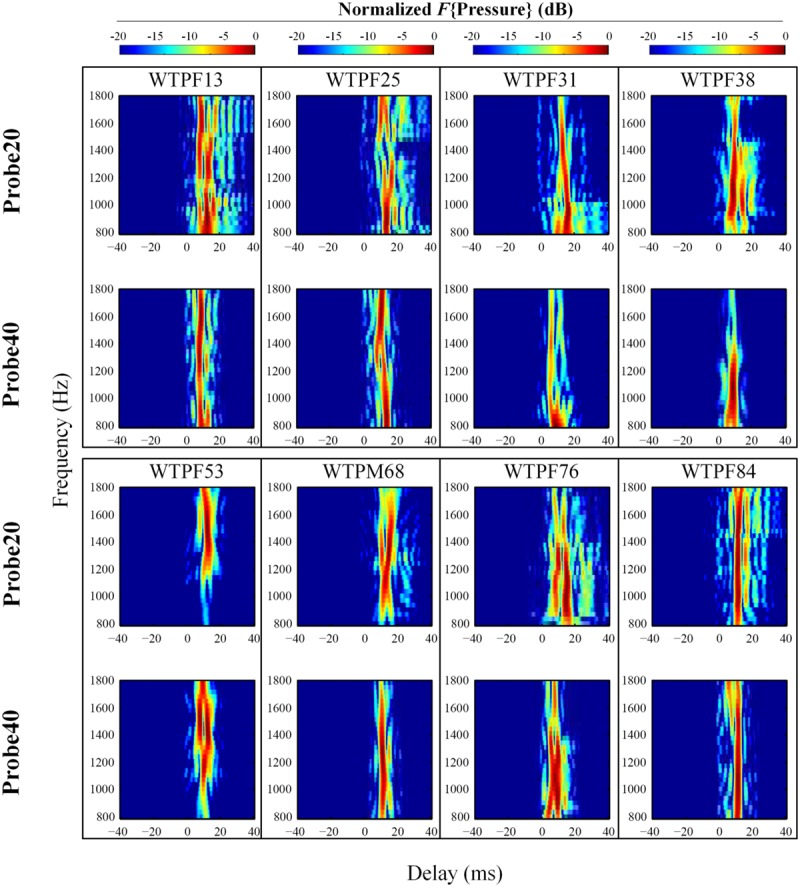
FIGURE 3.

Normalized results of inverse Fast Fourier Transform (IFFT) analysis on baseline SFOAE in eight subjects for 20 and 40 dB SPL probes. In order to evaluate the weighting of components with different phase-gradient delays, each heat plot was normalized to its own maximal value. Only signals within 20 dB of the peak were retained. SFOAE components with different phase-gradient delays appear as vertical color bands on the SFOAE frequency versus phase-gradient delay heat plots.
