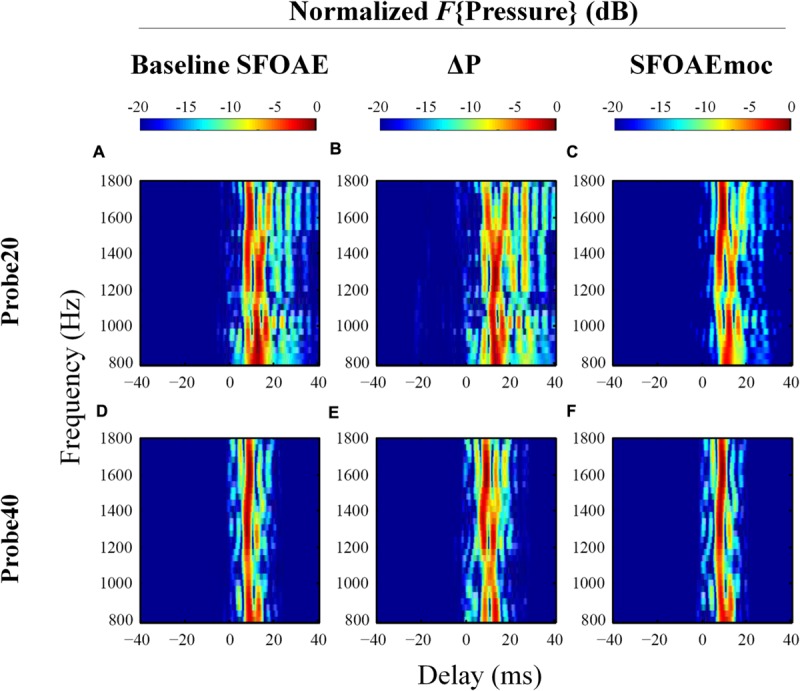
FIGURE 6.

Normalized results from IFFT analysis on baseline SFOAE (left column), ΔP (middle column) and SFOAEmoc (right column) from subject WTPF13. Compared with baseline SFOAE, ΔP appears to receive greater contribution from components of delays above 10 ms.
