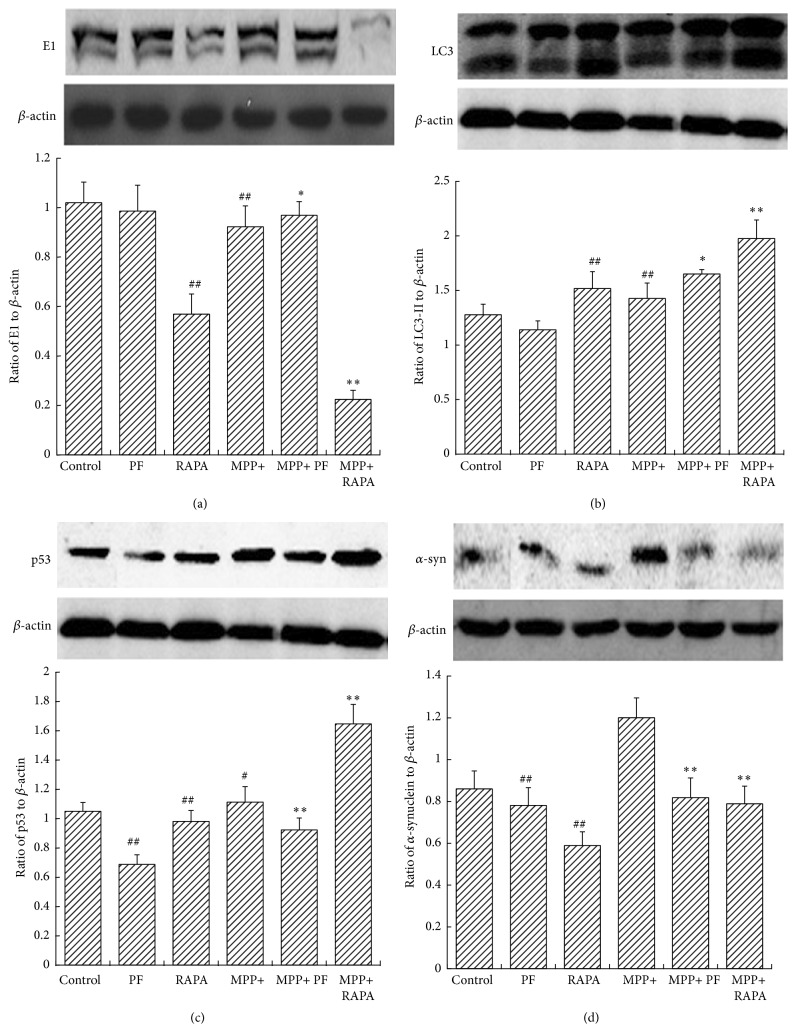
Figure 5.
Rapamycin and PF impact on α-synuclein and its degradation pathway. Western blots (upper panel in (a), (b), (c), and (d)) and statistical analysis of optical density measurements (lower panel in (a), (b), (c), and (d)) in PC12 cells after treatment with MPP+, PF, and RAPA for (a) E1, (b) LC3-II, (c) p53, and (d) α-synuclein. In MPP+ group, RAPA increased LC3-II and inhibited E1. PF upregulated both LC3-II and E1 significantly. Values represent mean ± SEM (n = 5). # P < 0.05, ## P < 0.01 versus control group. ∗ P < 0.05, ∗∗ P < 0.01 versus corresponding control group.

