Figure 1.

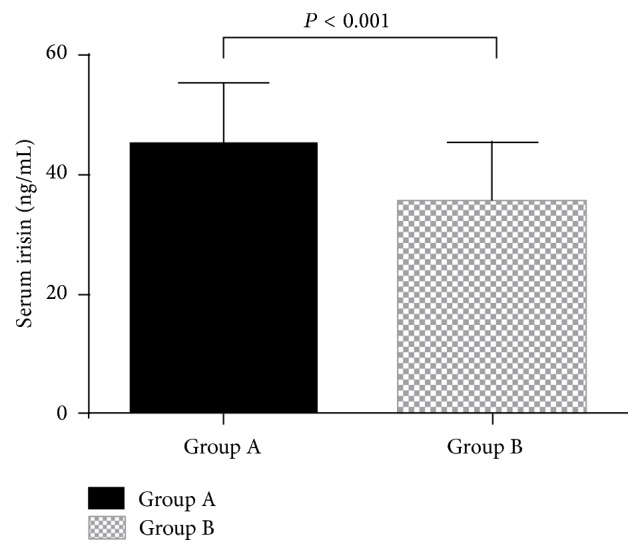
Baseline serum irisin levels in the study participants. The values are expressed as the means ± SD. Group A: type 2 diabetes patients with hypertriglyceridemia (n = 25). Group B: control subjects (n = 40).

Baseline serum irisin levels in the study participants. The values are expressed as the means ± SD. Group A: type 2 diabetes patients with hypertriglyceridemia (n = 25). Group B: control subjects (n = 40).