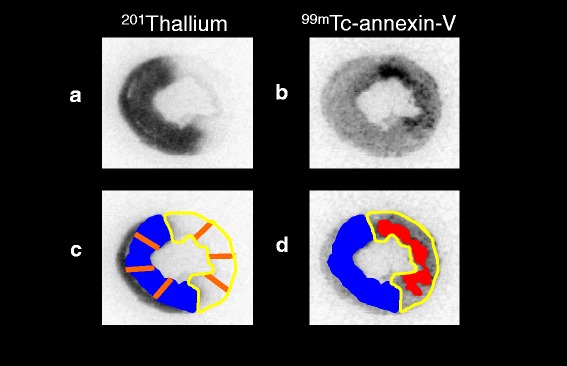
Fig. 1.

Measurement of parameters. The area at risk (AAR; curved yellow line) and normally perfused area (NA; blue painting) were defined from the 201Tl image (a, c), and these ROIs were applied to the 99mTc-annexin-V images (b, d). Regions of interest were drawn manually over the area with easily identifiable 99mTc-annexin-V uptake (d, red painting). The 201Tl image demonstrates the area at risk, while the 99mTc-annexin-V image reflects the area and intensity of apoptosis. Each area’s wall thickness was calculated as an average of three radial lines (c, orange line) those equally divided the area into four
