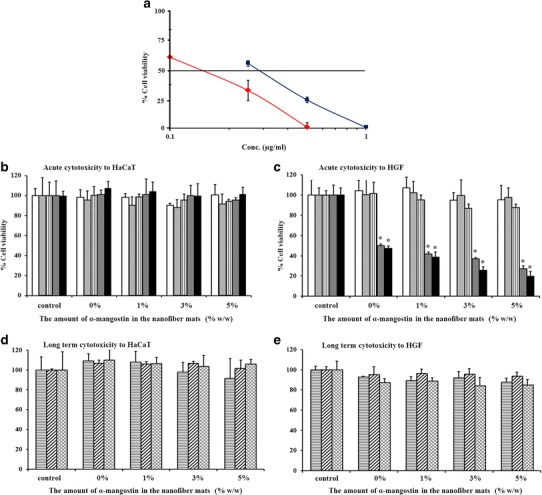
Fig. 6.

a The percentage of cell viability among  HaCaT cells and
  HGFs in the presence of α-mangostin at 0–1 μg/ml for 24 h and the percentage of cell viability among HaCaT cells and HGFs following (b and c) acute or (d and e) long-term exposure to the mucoadhesive nanofiber mats containing different amounts of α-mangostin, serving as an indicator of cytotoxicity: incubation for
  15,
15,  30,
30,  60,
60,  120,
120,  240 min,
  24,
24,  48, and
  72 h. *p <0.05
