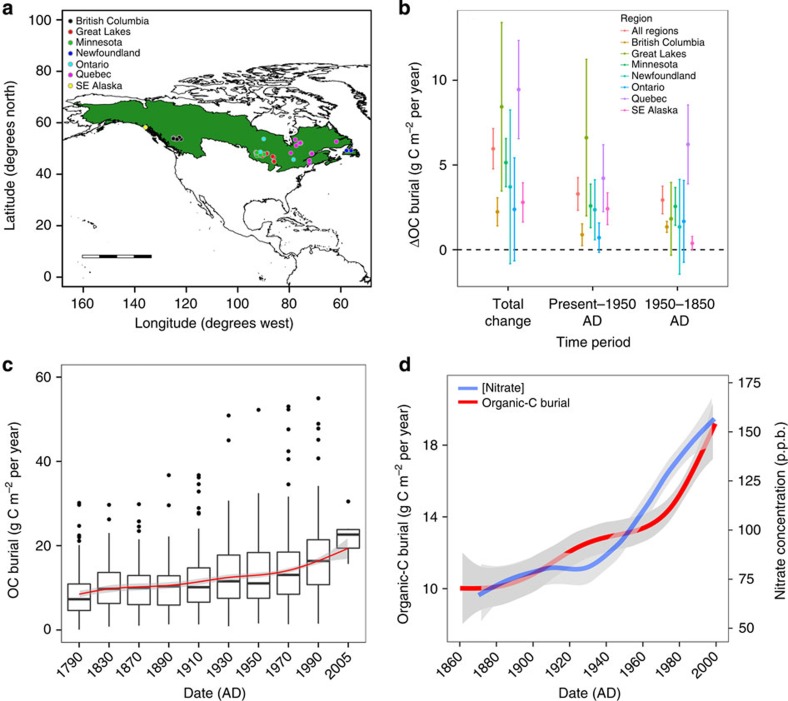
Figure 1. Organic-C burial in northern lakes.
(a) Map of North America with lakes included in this study coloured by region. The boreal and northern temperate forest biome (referred to as northern forest in this study) is shaded in green. Scale bar, 2,000 km. (b) Mean change in organic-C (ΔOC) burial rates between time periods for lakes in this study for all regions (n=101), British Columbia (n=10), the Great Lakes Region (n=13), Minnesota (n=39), Newfoundland (n=4), Ontario (n=3), Québec (n=28) and southeast Alaska (n=4). Error bars represent the 95% confidence interval around the mean and those that do not overlap zero represent a significant positive increase (t-test, P<0.05). (c) OC burial versus time, binned by 20-year intervals, from 1840 to 2000 AD. All dated sections older than 1840 and younger than 2000 AD were combined into two bins due to a low density of points for those time periods. The median for all bins was fit with a LOWESS smoother (red line), to show the general trend in organic-C burial over time. Boxes represent the interquartile range (IQR) with the median shown as a black bar. Whiskers represent the minimum/maximum value within × 1.5 the IQR with points outside plotted as black dots. (d) LOWESS smoother for OC burial from all lakes in this study versus time (red line) and atmospherically deposited nitrate concentrations (teal line) measured from the Greenland Ice Sheet. Greenland ice core data modified from Hastings et al.20.

