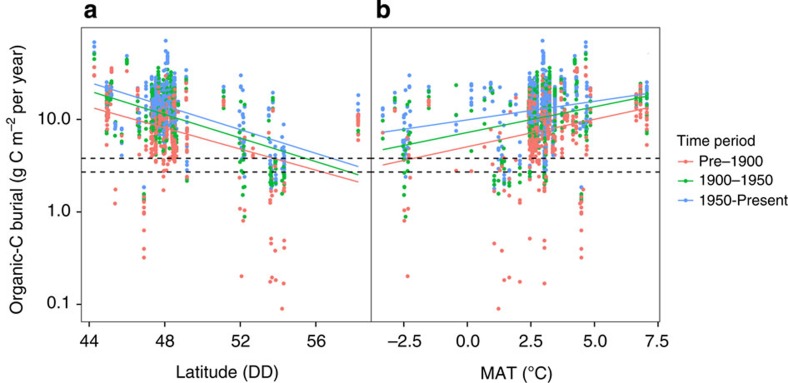
Figure 2. Geographic drivers of organic-C burial.
Organic-C burial rates for 101 northern lakes over a latitudinal (a) and temperature (b) gradient. The colour of the points represents three different time periods: before 1900 AD (orange), 1900–1950 AD (green) and 1950 to present day (blue). Solid lines represent least square regressions for each time period and dashed lines represent previously estimated Holocene burial rates for Finland2 (below; 2.7 g C m−2 per year) and Québec13 (above; 3.8 g C m−2 per year).

