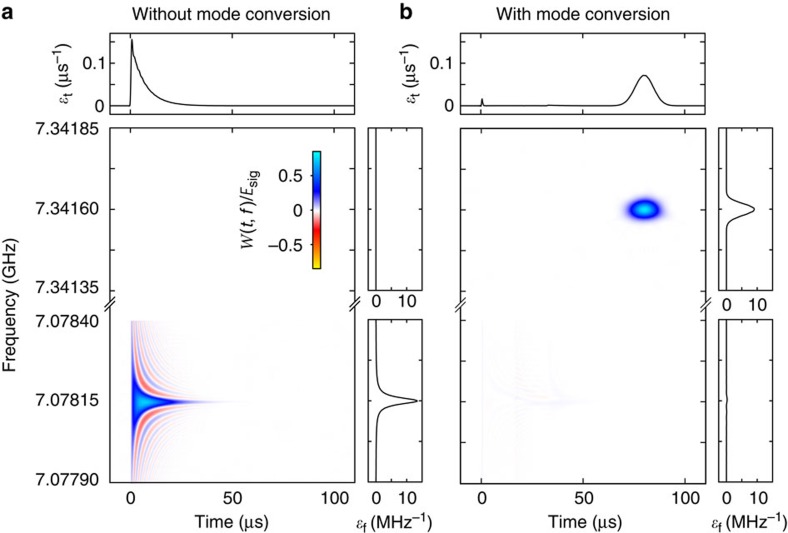
Figure 3. Temporal and spectral mode conversion of a microwave signal.
(a) Wigner–Ville distribution of a signal that reflects off the mode converter (so no mode conversion is performed) and is measured with a microwave receiver. The marginal distributions of the Wigner–Ville distribution show the signal is a decaying exponential in time, and a Lorentzian in frequency;  and
and  . The signal is centred near 7.07815 GHz and has a power decay rate of 2π × 24 kHz. There is no signal content near 7.34160 GHz. (b) Wigner–Ville distribution of a mode-converted signal. When the mode converter is used, the decaying exponential signal is captured as a vibration of the drumhead, and the signal content at 7.07815 GHz is almost entirely absent. Later in time, we recover the signal that is now centred near 7.34160 GHz and has a Gaussian temporal envelope and Gaussian spectral content with width 2π × 24 kHz.

