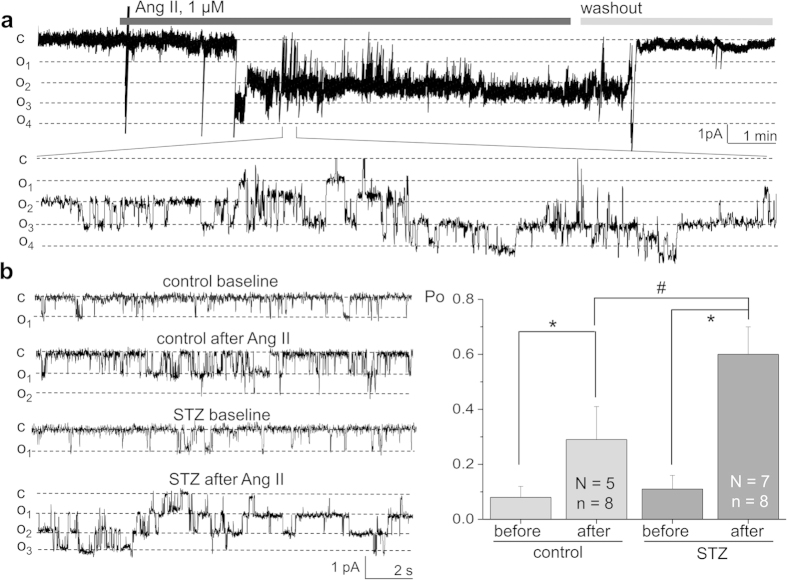
Figure 5. Activity of TRPC6 channels in response to Ang II in type 1 diabetes.
(a) A representative patch-clamp recording showing the activation of TRPC channels in the podocytes of the control (vehicle-treated) SS rats in response to application of 1 μM Ang II, followed by a washout of Ang II. c and oi denote closed and open states of the channel, respectively; a full recording (upper row) and a fragment of a recording at a larger scale are shown. The recording was obtained at −60 mV. (b) Right panel demonstrates a summary graph of the open probability (Po) of the TRPC channels recorded in the podocytes of the STZ-treated animals compared to control rats after acute stimulation with 1 μM of Ang II. Representative current traces illustrating TRPC channels’ activity in podocytes of diabetic rats vs. control animals (before and after application of Ang II) are shown on the left panel. N represents number of animals studied, and n is the number of analyzed patch-clamp recordings; the recordings were obtained at −60 mV. * and # denote statistical significance (P < 0.05).

