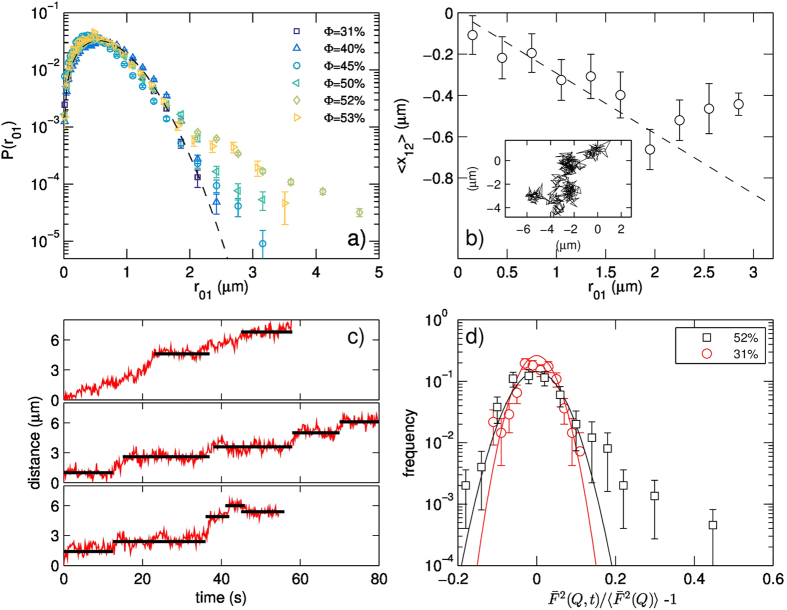
Figure 5.
(a) Self part of the Van Hove Correlation functions of the trajectories reported in Fig. 2, calculated for  , for increasing values of
  . The values of
  is chosen to correspond to the sub-diffusive trend of the mean square displacement found at high
  . At
. At  the data points lie on a Gaussian curve (dashed line), compatible with Brownian diffusion. At higher concentration, the distribution develops tails that are broader than in a Gaussian, indicating more frequent occurrence of long-range jumps. This is in agreement with the dynamical arrest picture. (b) The average value of the projection
  of a step
  along the direction of the previous step
  is reported as a function of the size
  of the first step. Steps have been measured at
  over time interval
  . The data follows a linear decrease (dashed line) which implies anticorrelation between the first and second step: this happens when one of the tracked object hits the “cage” of the surrounding neighbors and is pushed back towards the previous position. A deviation from the linear trend is observed for
  ; this length corresponds to the size of the “cage”. The inset shows a typical trajectory measured at
  ; the trajectory presents clusters of positions that are roughly
  in size. (c) Displacements of three different objects measured at
  , reported as a function of time. They present long periods of short range movements around a stationary position, followed by sudden jumps. Black lines highlight the time intervals between successive jumps. (d) Histogram of temporal intensity fluctuations of the Fourier transform of successive images for two values of
  with respect to the time-averaged value, measured at
  . While at
  the fluctuation histogram is compatible with a Gaussian curve (solid red line), at
  the distribution is characterized by a tail, which is broader than Gaussian, indicating that rearrangement events are taking place in the layer.

