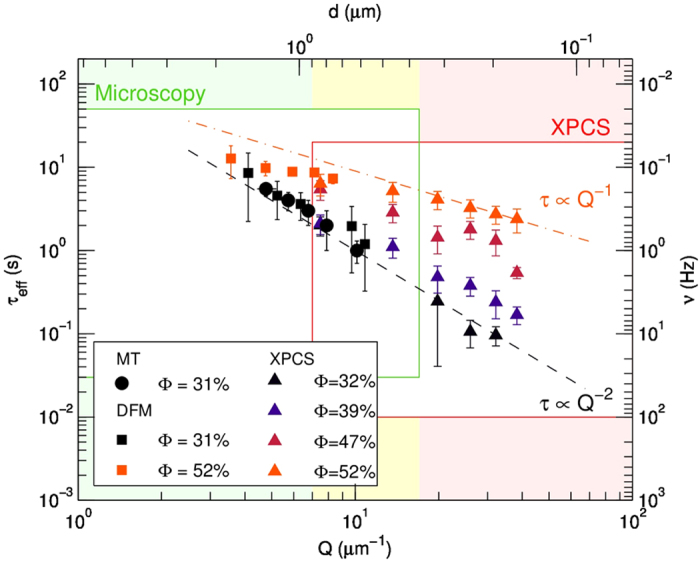
Figure 7. Comparison of the techniques: green and pink areas correspond to the domains of Microscopy and XPCS respectively; the framed region is covered by the present experiments, while generally accessible region is indicated by the larger shadowed area.

The yellow area is the overlap. We report XPCS relaxation times  (colored triangle) and DFM times (squares) as a function of Q, and MT times as function of displacements (circles). The diffusive regime,
  is the steeper dashed line, while the arrested regime,
  is the less steep dashed line. Correspondent frequencies
  and distances
  are reported on right and top axes for clarity. Note at each given concentration the good overlap of the results obtained by the different techniques.
