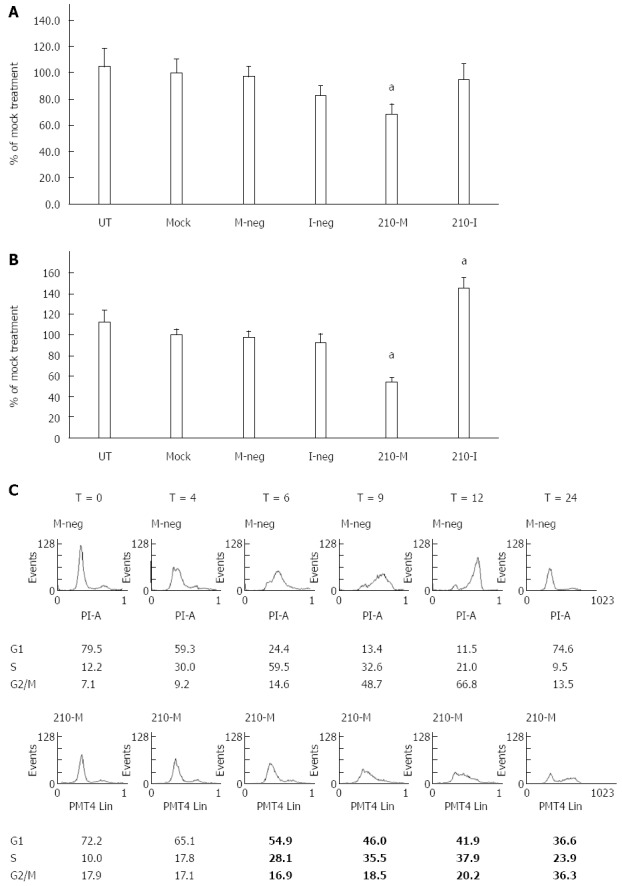
Figure 2.

Effects of miR-210 on proliferation of hepatocellular carcinoma cells. A and B: HepG2 cells (A) or HuH7 cells (B) were left untreated (UT), or mock transfected with Lipofectamine 2000 (Mock), or transfected with Mimic Negative Control (M-Neg), or Inhibitor Negative Control (I-Neg), or microRNA-210 Mimic (210-M), or microRNA-210 Inhibitor (210-I). Cell proliferation was determined using the MTS assay. Data shown are expressed as mean ± SD (n = 4). aP < 0.05, Student’s t-test analysis for comparison to the mock treatment; C: Flow cytometry analysis of HuH7 cells at various time points (T = 0 h - T = 24 h) following transfection with either M-neg or 210-M and synchronization of the cells. Percentage of total cell population in each phase is shown below each graph.
