
Figure 3. Histological quantification.
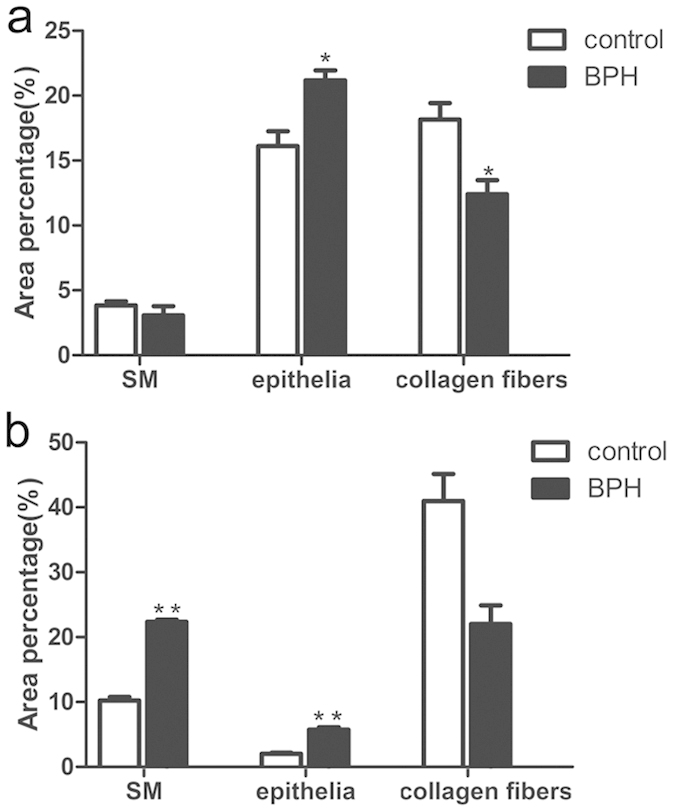
Area percentage of different component between normal and BPH group. The percentage of each component were quantified from three random 100 × fields of each tissue slices (n = 8 from each group) (a) rat prostate. (b) human prostate. Boxes, mean; bars, ± S.E.M; **P < 0.01 vs. control; *P < 0.05 vs. control.