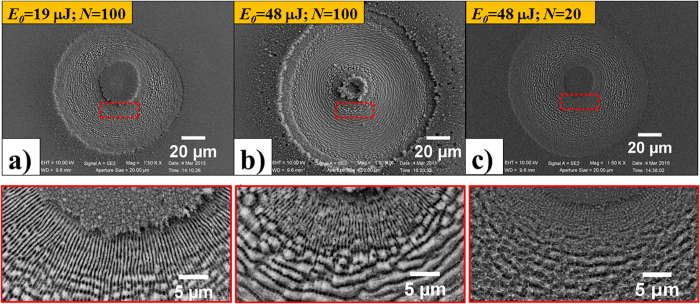
Figure 3.
SEM images of the surface structures on the silicon target after an irradiation sequence of N pulses with azimuthal SoP for two different values of the pulse energy and number of pulses: (a) E0 = 19 μJ, N = 100; (b) E0 = 48 μJ, N = 100; (c) E0 = 48 μJ, N = 20. The lower panels are zoomed views of the areas indicated by the red dashed box in the corresponding upper SEM images illustrating the dependence of the fine morphology of the surface structure on the laser pulse energy E0 and number of irradiating pulses N.

