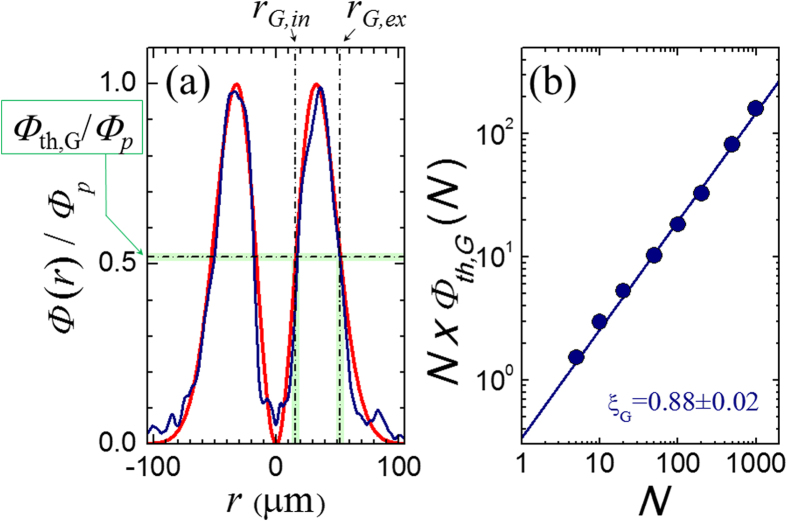
Figure 4.
(a) Example of the spatial profile of the annular beam as a function of the coordinate r along an axis coincident with a diameter of the OV beam (r = 0 marks the center of the OV beam). The blue line is the experimental profile, while the red line is a fit. (b) Variation of the threshold fluence Φth,G as a function of the number of pulses N displayed on a log-log plot of N × Φth,G(N) vs N. The uncertainty on the experimental data points is within the size of the symbols. The line is a fit to a power law dependence typical of an incubation behavior with a slope ξG = (0.88 ± 0.02). The data refer to an azimuthal SoP.

