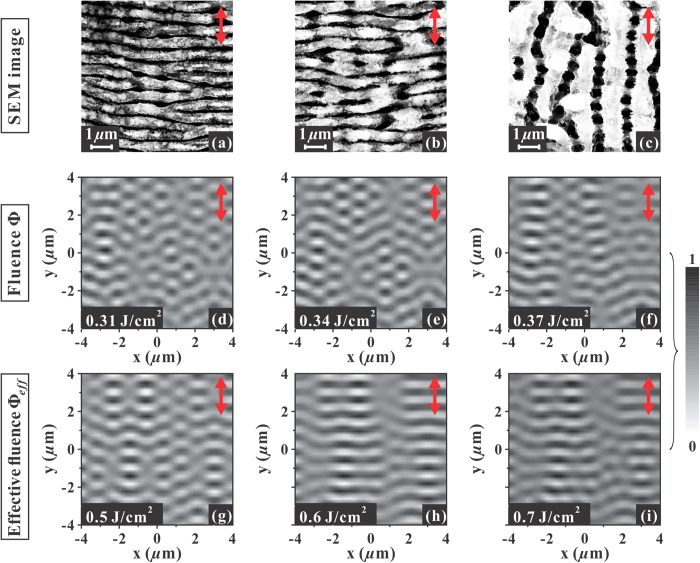
Figure 5.
Upper panels: SEM images of the surface structures on the silicon target after an irradiation sequence of N = 100 pulses with azimuthal SoP in the transitional region from ripples to grooves: panels (a–c) show ripples and grooves aligned perpendicular and parallel to the local laser polarization, respectively. Panel (b) corresponds to the transition region where grooves rudiments form on top of the underlying ripples and corresponds to a local value of the laser fluence ϕ ≈ Φth,G(1) = 0.34 J/cm2. Panels (d,f) report representative 2D-IFT maps of the efficacy factor calculated for three different values of the local laser fluence ϕ: panel (e) corresponds to ϕ = 0.34 J/cm2, while the other two side maps in panels (d,f) are relative to values of the fluence differing by ≈ ± 10% with respect to panel (e). Panels (g,i) show representative 2D-IFT maps of the efficacy factor calculated for three different values of the local laser fluence value ϕeff (see Eq. (2)): panel (h) corresponds to ϕeff = 0.6 J/cm2, while the other two size maps in panels (g) and (i) are relative to values of the fluence below (ϕeff = 0.5 J/cm2) and above (ϕeff = 0.7 J/cm2) the one of panel (h), respectively. In all the panels, the double-headed arrow indicates the local direction of the laser polarization. The 2D-IFT maps are normalized to their own corresponding maximum intensity according to the scale shown on the right.

