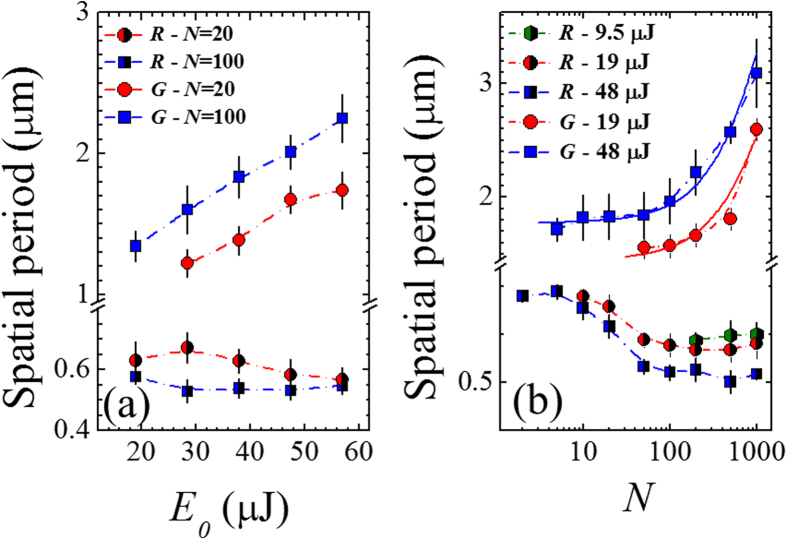
Figure 6.
(a) Variation of the spatial period of ripples and grooves as a function of the laser pulse energy E0, for two different values of the laser pulse number: N = 20 and N = 100. (b) Variation of the spatial period of ripples and grooves as a function of the number of pulses N for three different values of the laser pulse energy: E0 = 9.5 μJ, E0 = 19 μJ and E0 = 48 μJ. The two solid lines represent linear fits to the experimental data (note that data are reported on a lin-log plot). The legend R and G indicate ripples and grooves, respectively.

